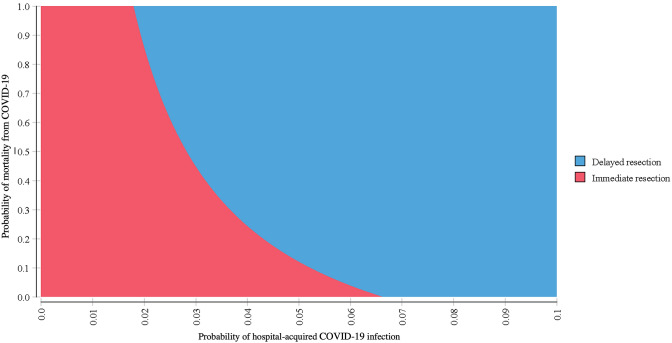
Fig. 2.
Two-way sensitivity analysis for probability of infection and mortality from COVID-19. Graph displays the favored strategy (immediate or delayed resection) across a range of possible perioperative COVID-19 infection and COVID-19-related mortality probabilities while holding all other model variables constant at baseline values (color figure online)

