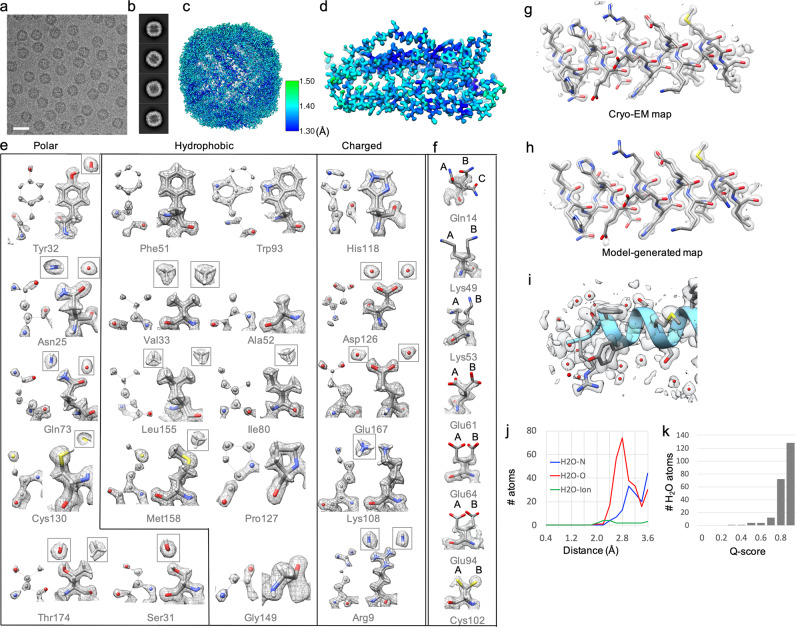
Fig. 1. Atomic resolution structure of apoferritin determined from a 300 kV Titan Krios G3i electron microscope with K3 detector.
a Representative motion-corrected cryo-EM micrographs. The scale bar represents 200 Å. b Reference-free 2D class averages of computationally extracted particles. c Resolution variation maps for the final 3D reconstruction. d Cryo-EM density map of an extracted single subunit. e Twenty representative amino acids extracted from the 1.34 Å resolution map. The amino acids were selected based on the type of side chain (polar, charged, and hydrophobic). Each residue is shown on a higher density display level (0.045 in Chimera, left) or lower density display level (0.008 in Chimera, right), showing separable/resolved atoms or shapes of atoms including hydrogen atoms, respectively. f Representative residues with alternate conformations of side chains. A/B/C represents different side-chain conformations. The residues in e and f are shown by elements (grey, carbon; red, oxygen; blue, nitrogen; yellow, sulfur; white, hydrogen). g, h A representative helix was extracted from the cryo-EM density map (g) and the model-generated map using B’ factors (h). i Water molecules are shown around a small portion of the helix. j A radial distance plot between water and O atoms in the protein shows a sharp peak at 2.8 Å resolution. k A histogram of Q-scores for placed waters shows that most are placed in well-resolved peaks with Q-scores of 0.8 and higher.

