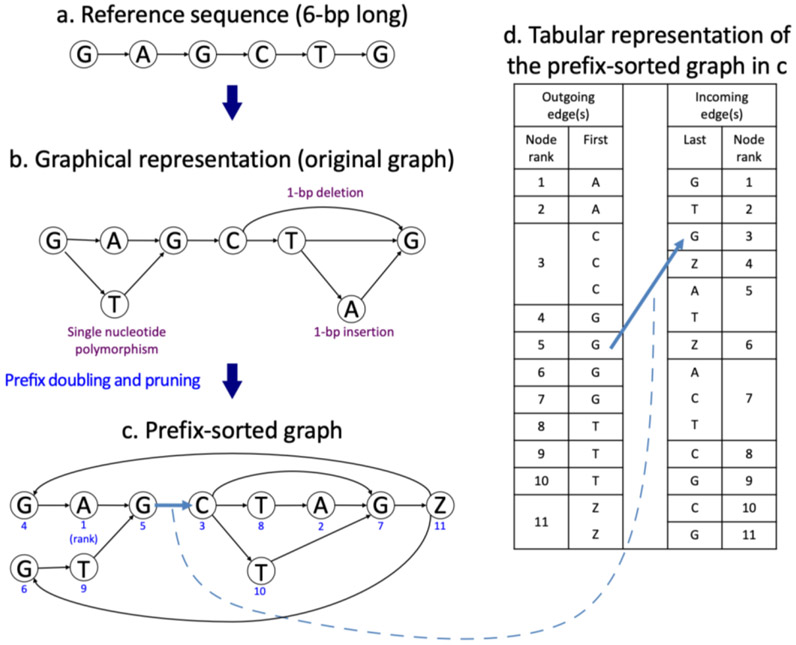
Figure 1.
Graph representation of indels and mutations and its tabular representation. Starting with a 6-bp reference sequence, GAGCTG (a), the lower graph (b) incorporates three variants: a single nucleotide variant (A/T), a 1-bp deletion (T), and a 1-bp insertion (A). A prefix-sorted graph of the graph (c) has 11 nodes and 14 edges. Each node has a unique numerical node ID shown in blue to indicate its lexicographical order (1 being the first) with respect to the other nodes in the graph. The node labeled with ‘Z’ demarcates the end of the reference sequence. The table on the right (d) has two columns under Outgoing edge(s) that show the node IDs and their labels repeated according to the number of their outgoing edges (i.e. node 3, labeled C, is repeated three times with 3 outgoing edges to nodes 7, 8, and 10, respectively). The table has two columns under Incoming edge(s) that show the node IDs and the 14 labels for the preceding nodes (i.e. G is the preceding label for node 1, A and T for node 5). The table is more compact in memory usage than the graph representation.

