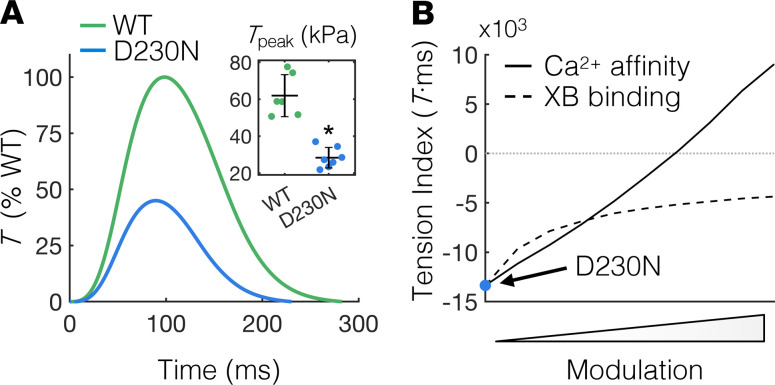
Figure 2. Measuring and modulating the tension index of D230N hearts.
(A) Average twitch T traces of intact trabeculae from WT and D230N hearts as a percentage of WT T. The Tpeak of trabeculae from D230N hearts is approximately half that of WT (inset). Sample sizes of n = 6 and n = 7 for WT and D230N trabeculae, respectively. The error bars of the inset represent SD and *P < 0.01 using a 2-tailed unpaired Student’s t test. (B) Dependence of the T index of simulated D230N twitches on modulation of XB or Ca2+ binding. The simulated T index for D230N twitches without any modulation is indicated by the blue circle. The rate of XB transition from a weak to a strong (T-generating) state was independently increased to simulate D230N twitches with augmented XB binding (dashed line). The affinity of Ca2+ for cTnC was also independently increased to simulate twitches of D230N cardiomyocytes with augmented Ca2+ sensitivity (solid line). T, tension; Tpeak, peak twitch tension; XB, cross-bridge; Ca2+, calcium; cTnC, cardiac troponin C.

