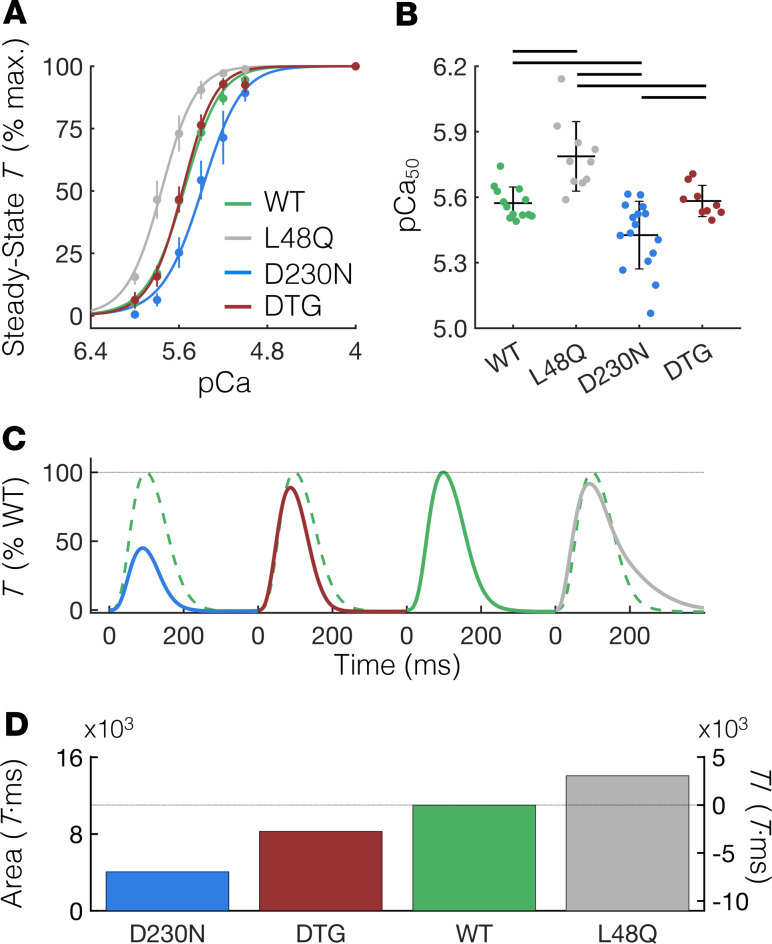
Figure 4. L48Q cTnC prevents contractile abnormalities in cardiac tissue isolated from hearts containing D230N tropomyosin.
(A) Steady-state T as a percentage of the maximum value (at pCa 4.0) of demembranated cardiac muscle measured over a range of extracellular Ca2+ concentrations (pCa = –log([Ca2+]). The data are fit with the Hill equation (see Methods section) shown by the solid lines. (B) The pCa at half-maximal T (pCa50) of cardiac preparations from D230N hearts is significantly less than all other groups, whereas the pCa50 of preparations from L48Q plus D230N DTG hearts is not different from WT. Error bars represent SD. Black lines above the bars indicate P < 0.05 between groups using a 1-way ANOVA and a Tukey’s post hoc test of significance. (C) Average twitch T-time traces (in % WT Tpeak) of intact trabeculae for each genotype (same color scheme as panel A). The WT T-time trace is shown as a dashed green trace against each variant twitch for comparison. (D) The area under the T-time trace (left ordinate) for each genotype and the resulting TI (right ordinate). See Supplemental Table 2 for numerical values. T, tension; cTnC, cardiac troponin C; Ca2+, calcium; Tpeak, peak twitch tension; DTG, double-transgenic.

