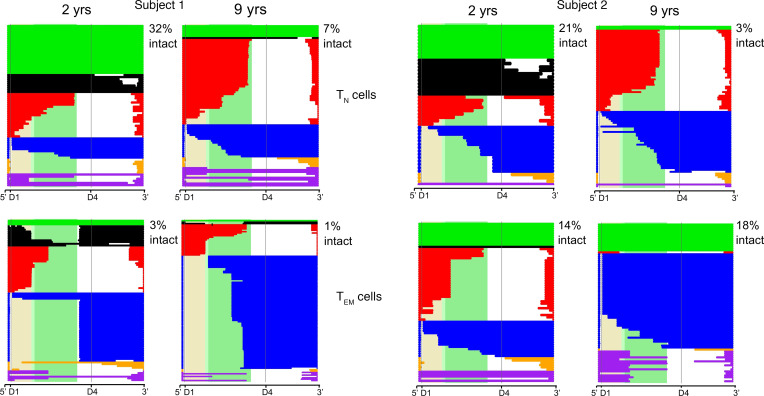
Figure 3. Deletion maps for proviruses retrieved from TN and TEM cells at 2 and 9 years after ART initiation.
Intact and defective proviruses from TN and TEM cells were aligned to HXB2 at an early and late time point after ART initiation. Each horizontal bar represents 1 proviral sequence. Proviruses are color-coded based on size and location of deletion. Green bars are intact (D1+D4+), black bars are nearly intact (D1+D4+), red bars are 3′ deleted (D1+D4–), blue bars are 5′ deleted (D1–D4+), and yellow bars are massively deleted (D1–D4–) proviruses. Hypermutated proviruses are represented as purple bars. The shaded beige, light green, and dark green regions correspond to the gag, gag-pol, and pol regions of HXB2, respectively. The percentage of intact proviruses is reported in the upper right corner of each deletion map.

