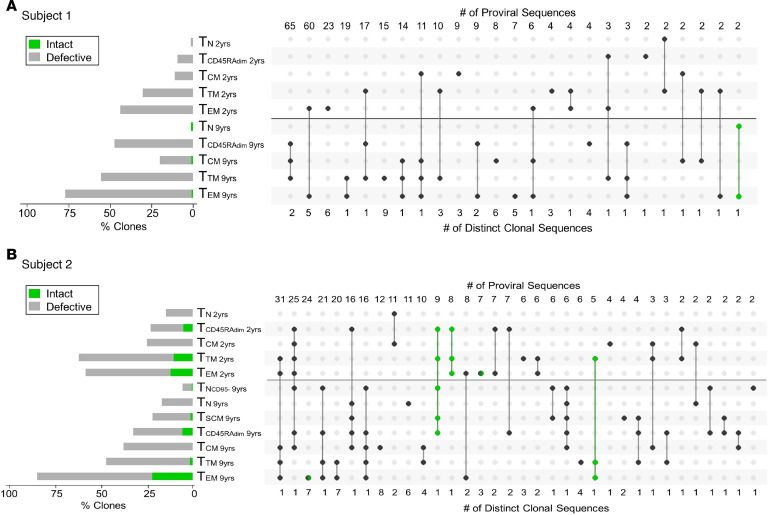
Figure 7. Modified proviral clone UpSet plots.
(A and B) Modified proviral clone UpSet plot for Subject 1 (A) and Subject 2 (B) shows that clonal expansion progressively increases with cell differentiation and is more prominent among defective proviruses. Proviral clones were identified as repeated sequences. The horizontal bars on the left side show the percentage of repeated sequences found in each subset (green for intact sequences and gray for defective ones). A black horizontal line separates the 2 time points (2 and 9 years after ART initiation). Intact proviral clones are shown in green. For those proviral clones that could be detected in multiple subsets, a solid line was used to connect these subsets. The numbers at the top of the UpSet plot represent the number of proviral sequences that could be found in the same subsets within a category. The numbers below the UpSet plot represent the number of distinct clonal sequences. For example, for Subject 2 (B), we identified 308 repeated sequences. The first column shows that we detected 1 distinct clone made up by 31 proviral sequences in TEM and TTM at both time points, as well as TCM cells at the second time point. For Subject 1, we identified 303 repeated sequences (A). We also identified 5 intact clones for Subject 2 (B) and 1 proviral clone for Subject 1 (A). yrs, years after ART initiation.

