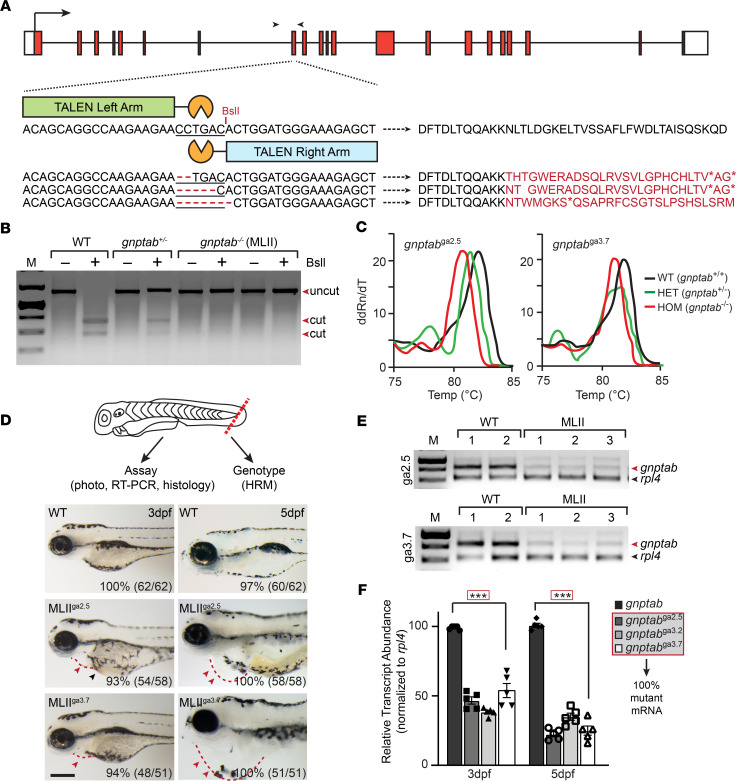
Figure 1. TALEN-mediated KO of gnptab disrupts cardiovascular development.
(A) Schematic of gnptab gene shows the locations of the left and right TALEN arms, the PCR primers used for genotyping (black arrowheads), and 3 isolated zebrafish lines carrying 2, 5, and 7 bp frame-shifting deletions. The predicted “translation” of these products is listed. (B) BslI digestion of genomic DNA identifies gnptab WT (+/+), heterozygous (+/–), and homozygous mutant (–/–, MLII) animals. (C) High-resolution melt analyses yields unique patterns that confirm the 3 expected genotypes. (D) Schematic illustrates live embryo dissections used in HRM analyses to assign the genotypes before experiments. Images of 3- and 5-dpf-old WT and MLII (gnptab–/–) animals from lines carrying 5 and 7 bp deletions (gnptabga2.5 and gnptabga3.7) show progressive cardiac edema. Percent values equal the number of embryos exhibiting phenotypes similar to the picture. n = 50–60 embryos from 4–5 independent matings per line. Scale bar: 100 μm. Red arrowheads indicate edema; black arrowhead indicates pooled blood. (E) RT-PCR analyses of gnptab expression of embryos from 2 pools of WT and 3 pools of 5 bp–deleted and 7 bp–deleted embryos show reduced transcript abundance. Analyses of rpl4 transcripts provides an internal reference. Representative gel of 4 independent experiments. (F) Quantitation of transcript abundance show 60%–75% reduction in MLII lines from 3 to 5 dpf. Gel extraction and sequencing show 100% of residual transcripts in the mutant lines are mutant mRNAs. n = 100 embryos from 4 experiments, with 20 cloned transcripts sequenced per condition. ***P < 0.001, Dunnett’s test with correction.

