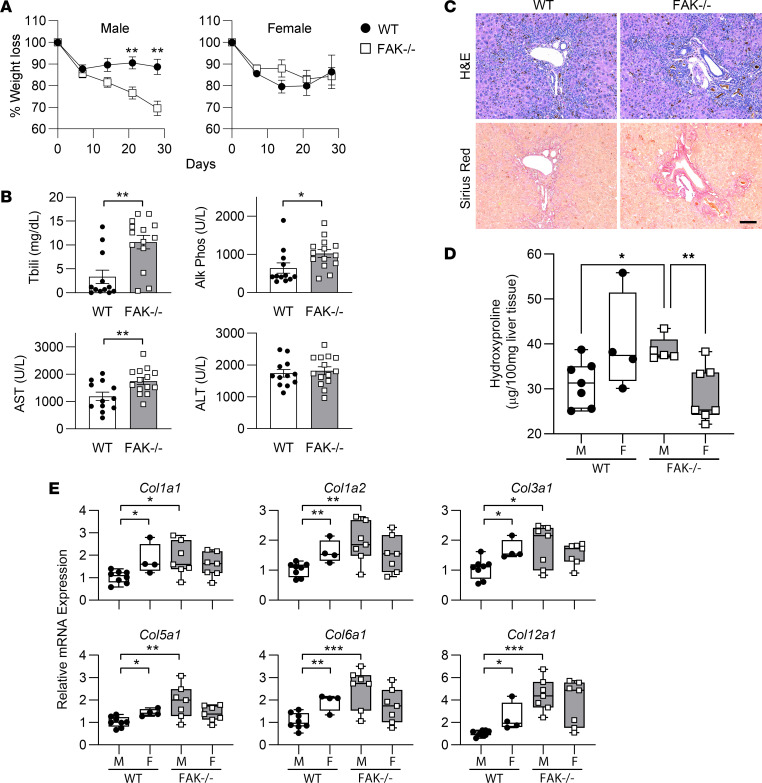
Figure 5. Male and female FAKfl/fl Alb-Cre+ mice (FAK–/–) or FAKfl/fl Alb-Cre– littermate controls (WT) were given 0.1% DDC diet to induce liver fibrosis.
(A) Male FAK–/– mice (n = 7) lost significantly more weight than sex-matched controls (n = 12). Linear regression analysis showed that slopes of the 2 lines for male mice were significantly different (P < 0.05). Percentage weight loss in male mice was significantly different comparing WT and FAK–/– by Student’s 2-tailed t test at days 21 and 28, **P < 0.01. Weight loss was not significantly different between female WT (n = 4) and FAK–/– (n = 8). Data represent mean ± SEM. (B) Serum liver function tests for WT (male n = 8, female n = 4) and FAK–/– mice (male n = 7, female n = 7). Data show individual data points and mean ± SEM. Tbili, total bilirubin. (C) Representative liver histology. Scale bar: 100 μm. (D) Liver hydroxyproline content of WT male (M; n = 7) and female (F; n = 4) compared with FAK–/– male (n = 5) and female (n = 7) mice. (E) mRNA expression of various collagen species as determined by qRT-PCR in WT (M, n = 8; F, n = 4) and FAK–/– (M, n = 7; F, n = 7) mice. Two-way ANOVA showed significant interaction between FAK genotype and sex (P < 0.05) for (D) and every collagen species except Col12a1 in E; genotype contributed significantly to the overall variation for Col5a1, Col6a1, and Col12a1 (P < 0.05). Groups were also compared by Student’s 2-tailed t test in B, D, and E, *P < 0.05, **P < 0.01, and ***P < 0.001. Box plots show individual data points, median, interquartile range, and range.

