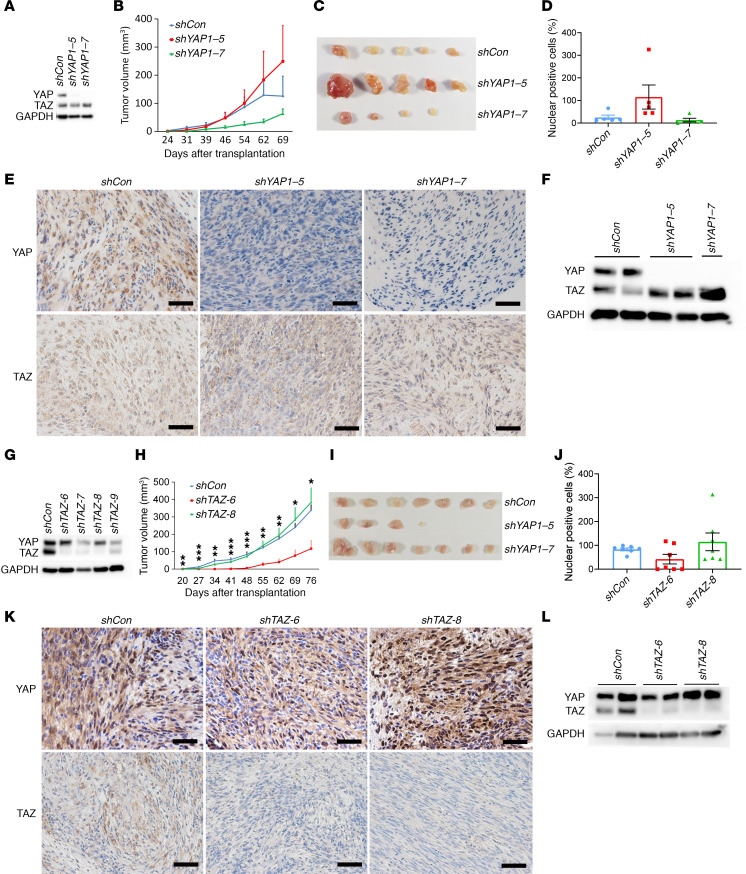
Figure 3. Loss of YAP or TAZ alone does not inhibit schwannoma proliferation.
(A) Western blot analysis of YAP and TAZ protein level in shControl, shYAP-5, and shYAP-7 transduced tumor cells (Hoxb7-Cre;Lats1fl/+;Lats2fl/fl). shCon, shControl. (B) Tumor volume of shControl, shYAP-5, and shYAP-7 transduced tumor cells after transplantation into nude mice (n = 5/group). (C) Gross picture of tumors from the experimental endpoint in B (n = 5/group). (D) Average weight of excised tumors from C (n = 5/group). (E) Representative images of allografted tumor sections stained for YAP and TAZ. (F) Western blot analysis of YAP and TAZ protein level in cultured tumor–derived cells. (G) Western blot analysis of YAP and TAZ protein level in shControl, shTAZ-6, shTAZ-7, shTAZ-8, and shTAZ-9 tumor cells. (H) Tumor volume of shControl, shTAZ-6, and shTAZ-8 schwannomas in nude mice (n = 7/group). (I) Gross picture of tumors from the experimental endpoint in H (n = 7/group). (J) Average weight of excised tumors from I (n = 7/group). (K) Representative images of tumor sections stained for YAP and TAZ. (L) Western blot analysis of YAP and TAZ protein levels in cultured tumor cells derived from tumors in I. Scale bars: 50 μm. One-way ANOVA was applied to evaluate statistical significance in B, D, H, and J. All statistics are represented as the mean ± SEM. *P < 0.05, **P < 0.01, ***P < 0.001.

