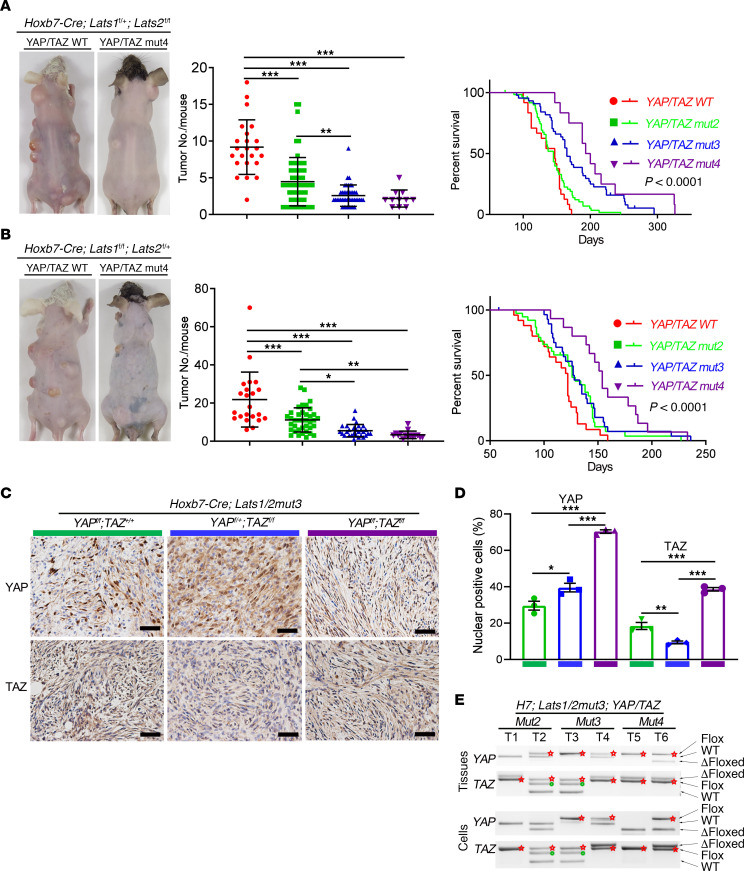
Figure 4. YAP/TAZ gene dosage determines the tumor burden and survival.
(A and B) Representative pictures of tumor-burdened mice (left panel). Scatter plot of the total number of palpable tumors in each mouse (middle panel). Kaplan-Meier plot illustrating the survival curve among the groups with corresponding genotypes (right panel) for Hoxb7-Cre;Lats1fl/+;Lats2fl/fl (A) and Hoxb7-Cre;Lats1fl/fl;Lats2fl/+ (B) mice. H7;Lats1fl/+;Lats2fl/fl;YAP/TAZmut4, n = 12. H7;Lats1fl/+;Lats2fl/fl;YAP/TAZmut3, n = 44. H7;Lats1fl/+;Lats2fl/fl;YAP/TAZmut2, n = 60. H7;Lats1fl/+;Lats2fl/fl;YAP/TAZWT, n = 24. H7;Lats1fl/fl;Lats2fl/+;YAP/TAZmut4, n = 15. H7;Lats1fl/fl;Lats2fl/+;YAP/TAZmut3, n = 29. H7;Lats1fl/fl;Lats2fl/+;YAP/TAZmut2, n = 39. H7;Lats1fl/fl;Lats2fl/+;YAP/TAZWT, n = 25. (C) IHC of YAP and TAZ on tumor sections. (D) Quantification of IHC in C (n = 3/group). (E) Genotyping of tumor tissues (upper panel) and tumor-derived cell lines (lower panel). Red star, intact floxed allele. Green dot, nonspecific amplification. Scale bars: 50 μm. One-way ANOVA with Tukey’s test for multiple comparisons were applied to evaluate statistical significance in A, B, and D. Log-rank statistical test was employed in A and B. Statistics are represented as the mean ± SEM. *P < 0.05, **P < 0.01, ***P < 0.001.

