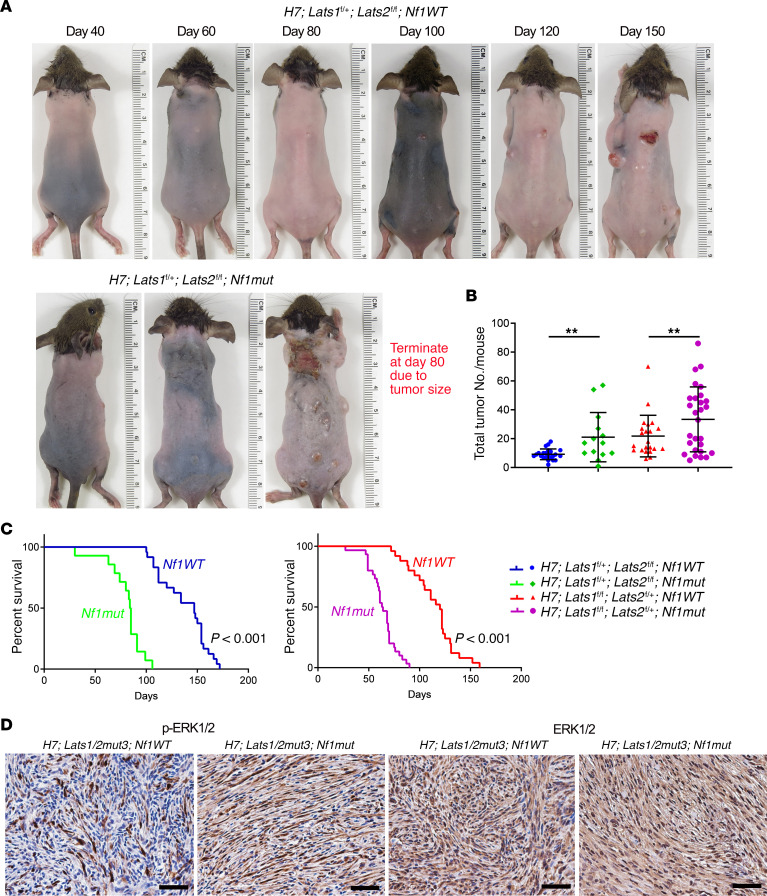
Figure 6. The MAPK pathway is a modifier of schwannomagenesis.
(A) Representative pictures of H7;Lats1/2mut3;Nf1wt (upper panel) and H7;Lats1/2mut3;Nf1mut (lower panel) mice. (B) Scatter plot of the total palpable tumor number in each mouse. H7;Lats1fl/+;Lats2fl/fl;Nf1wt, n=24. H7;Lats1fl/+;Lats2fl/fl;Nf1mut, n = 14. H7;Lats1fl/fl;Lats2fl/+;Nf1wt, n = 24. H7;Lats1fl/fl;Lats2fl/+;Nf1mut, n = 29. (C) Survival comparison between the H7;Lats1fl/+;Lats2fl/fl;Nf1wt and H7;Lats1fl/+;Lats2fl/fl;Nf1mut groups (left panel). Survival comparison between the H7;Lats1fl/fl;Lats2fl/+;Nf1wt and H7;Lats1fl/fl;Lats2fl/+;Nf1mut groups (right panel). H7;Lats1fl/+;Lats2fl/fl;Nf1wt, n = 24. H7;Lats1fl/+;Lats2fl/fl;Nf1mut, n = 14. H7;Lats1fl/fl;Lats2fl/+;Nf1wt, n = 24. H7;Lats1fl/fl;Lats2fl/+;Nf1mut, n = 29. (D) IHC of phospho-ERK1/2 and total ERK1/2 in H7;Lats1/2mut3;Nf1wt and H7;Lats1/2mut3;Nf1mut tumor sections. Scale bars: 50 μm. Two-tailed Student’s t test was applied to evaluate statistical significance in B. Log-rank statistical test was employed in C. Statistics are represented as the mean ± SEM. **P < 0.01.

