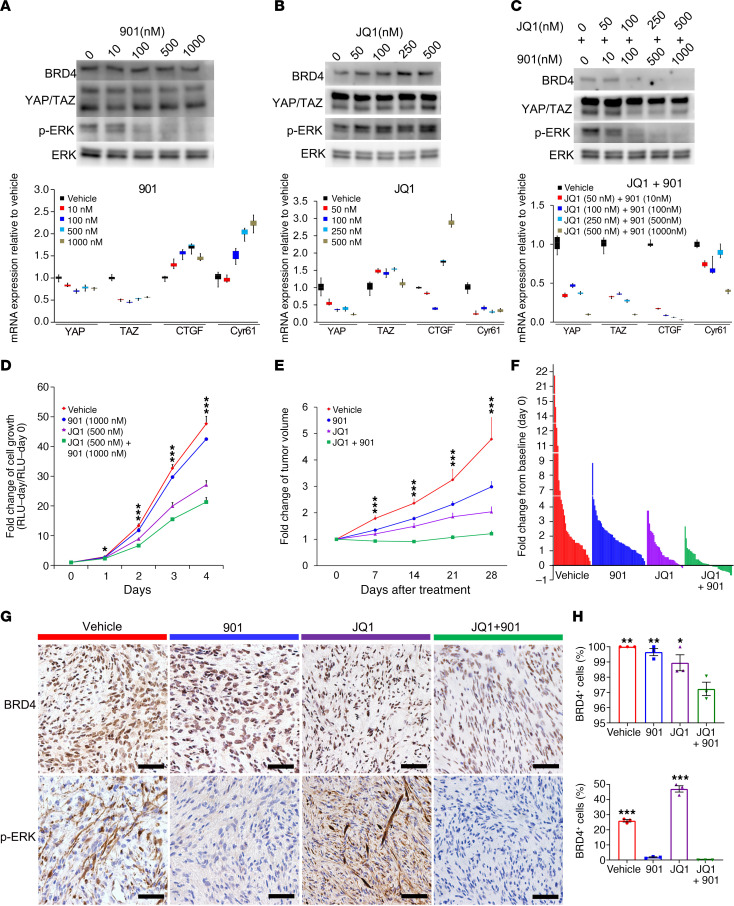
Figure 7. MAPK pathway inhibition sensitizes schwannoma to JQ1 treatment.
(A–C) Western blot (top) and qPCR (bottom) analysis of a mouse schwannoma cell line (1162, generated from a schwannoma of a H7;Lats1/2mut3 mouse) treated with 901 (A), JQ1 (B), or both (C). (D) Effect of treatment of 901, JQ1, or both on mouse schwannoma cell growth using ATP CellTiter Glo assay. n = 3/group. (E) Fold change of tumor volume with treatment of 901, JQ1, or both on tumor-burdened H7;Lats1/2mut3 mice. Vehicle, n = 34. 901, n = 48. JQ1, n = 33. JQ1 + 901, n = 43. (F) Waterfall plot depicting fold change of tumor volume from baseline (day 0) after treatment with 901, JQ1, or both. Vehicle, n = 34. 901, n = 48. JQ1, n = 33. JQ1 + 901, n = 43. (G) IHC of BRD4 and phospho-ERK1/2 in mouse schwannomas treated with vehicle, 901, JQ1, or both. (H) Quantification of IHC in G. Scale bars: 50 μm. All statistical comparisons made to JQ1 + 901. n = 3/group. One-way ANOVA was applied to evaluate statistical significance in D and E. Box plots show median (line) and 25th to 75th percentile (box). The end of the whiskers represents the minimum and the maximum of all of the data in A, B, and C. One-way ANOVA with Tukey’s test for multiple comparisons were applied to evaluate statistical significance in H. All statistics are represented as the mean ± SEM. *P < 0.05, **P < 0.01, ***P < 0.001.

