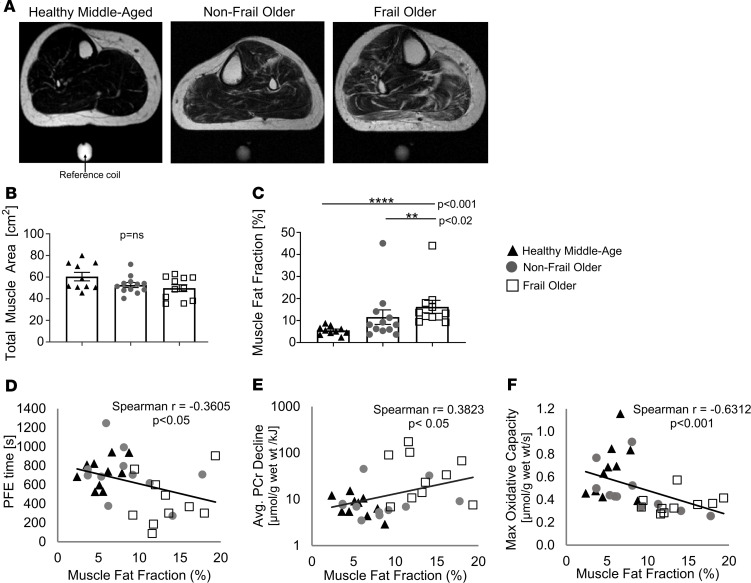
Figure 6. Muscle fat, energetics, and exercise duration.
(A) Magnetic resonance images showing fat distribution (white signal) in the calf of a healthy middle-aged (left), nonfrail older (middle), and frail older (right) individual. Total cross-sectional muscle areas across the 3 groups did not differ (B), however muscle fat content was significantly elevated in frail older individuals (C). (D) Correlation between PFE time and muscle fat fraction percent (without outliers). (E) Correlation between average PCr decline and muscle fat fraction percent (without outliers). (F) Correlation between maximal oxidative capacity and muscle fat fraction percent (without outliers). See Supplemental Data for all comparison figures with and without outliers. Muscle fat fraction was considered an outlier if intramuscular fat content exceeded 42%, which included 2 participants (1 frail, 1 nonfrail). Data are individual points and shown as mean ± SEM. CONT (n = 10 black triangles), NFO (n = 11 dark-gray circles), FO (n = 10 open squares). Spearman’s correlations were used. A P value less than 0.05 was considered significant with or without outliers. *P < 0.05, **P < 0.02, ***P < 0.005, ****P < 0.001.

