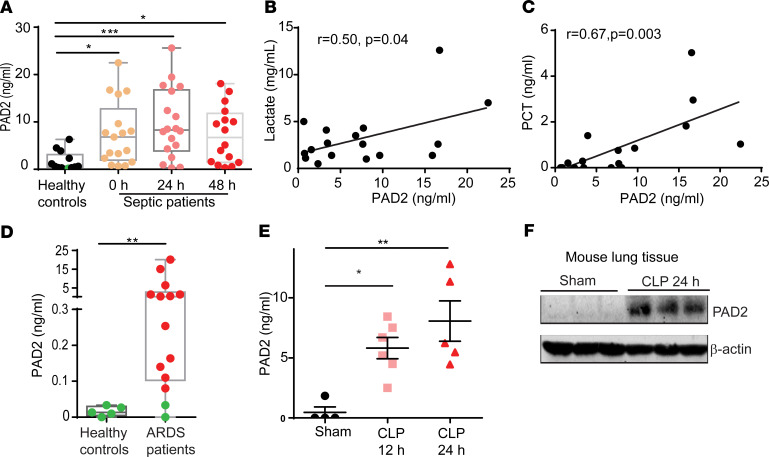
Figure 1. PAD2 protein is increased in patients with sepsis and a murine model of sepsis.
(A) Levels of serum PAD2 protein in healthy controls and patients with sepsis. Serum samples from patients with sepsis collected at enrollment, 24 hours, and 48 hours (n = 13–18/group) were assayed. (B) Correlation of serum concentrations of PAD2 protein and lactate in patients with sepsis at enrollment (n = 17). (C) Correlation of serum concentrations of PAD2 protein and procalcitonin (PCT) in patients with sepsis at enrollment (n = 17). The line in the graphs represents the linear fit. (D) Levels of PAD2 protein in bronchoalveolar lavage fluid from healthy controls and patients with ARDS (n = 5 for healthy controls and n = 14 for patients with sepsis-induced ARDS). (E) Levels of serum PAD2 protein in sham and CLP mice at 12 hours and 24 hours (n = 4–6/group). (F) Western blot results show the expression of PAD2 protein in mouse lung tissue with or without CLP (n = 3). Nonnormality data are expressed as minimal to maximal value with quantile range (A and D). Data in E are expressed as mean ± SEM. Data with 3 or more groups were analyzed by Kruskal-Wallis test with Dunnett’s multiple comparisons test (A) or 1-way ANOVA with Bonferroni’s multiple comparisons test (E). Two groups were analyzed using Mann-Whitney U test (D). Correlations between concentrations of PAD2 and lactate or PCT were analyzed using Pearson correlation model. *P < 0.05, **P < 0.01, ***P < 0.001. The green dots in A and D were values below the lower limit of quantification of the ELISA kit but based on standard curve back calculation.

