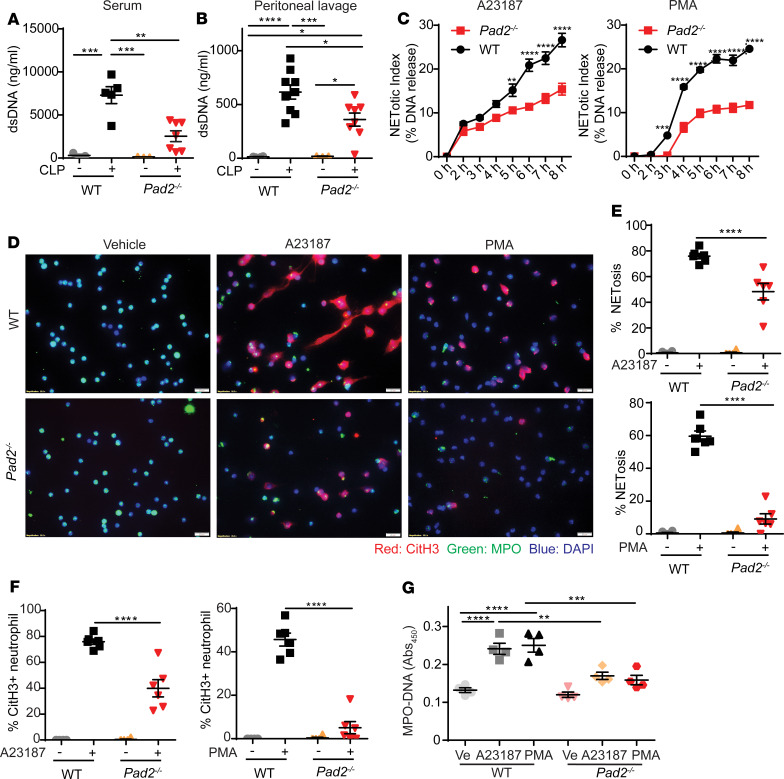
Figure 5. Absence of the Pad2 gene inhibits NET formation both in vivo and in vitro.
WT and Pad2–/– mice were subjected to CLP. (A and B) The concentrations of dsDNA in mouse serum (n = 3 for WT mice without CLP group, n = 5 for WT mice with CLP group, n = 3 for Pad2–/– mice without CLP group, n = 7 for Pad2–/– mice with CLP group) (A) and peritoneal lavage (n = 4 for WT mice without CLP group, n = 9 for WT mice with CLP group, n = 3 for Pad2–/– mice without CLP group, and n = 8 for Pad2–/– mice with CLP group) (B) after 24 hours. BM neutrophils were isolated from WT and Pad2–/– mice and were treated with A23187 or PMA. (C) NET formation in response to calcium ionophore and PMA in WT and Pad2–/– neutrophils at different time points (n = 3–5/group). (D) Representative immunofluorescence images of the NET formation in WT and Pad2–/– neutrophils after vehicle, Ca2+ ionophore (A23187), or PMA treatment for 3.5 hours. (E and F) Quantification results of immunofluorescence images (n = 6/group). (G) Levels of myeloperoxidase-DNA (MPO-DNA) in cell supernatant of WT and Pad2–/– neutrophils after vehicle, A23187or PMA treatment for 3.5 hours. Results are representative of 2 independent experiments (C–G). Data are expressed as mean ± SEM. Data were analyzed by 2-way ANOVA with Bonferroni’s multiple comparisons test (A–C and E–G). *P < 0.05, **P < 0.01, ***P < 0.001, ****P < 0.0001. Scale bar: 50 μm. Ve, vehicle.

