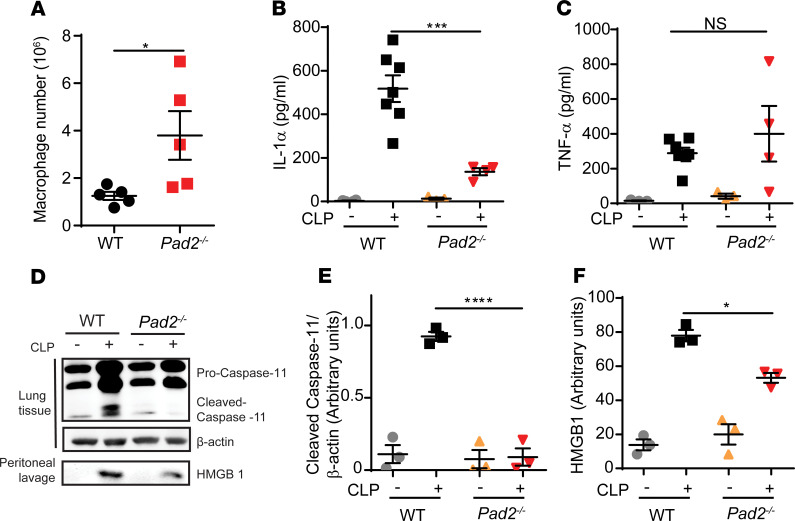
Figure 6. Absence of the Pad2 gene inhibits Caspase-11–dependent noncanonical pyroptosis in a CLP murine model of sepsis.
WT and Pad2–/– mice were subjected to CLP. (A) Macrophage number in peritoneal cavity of WT and Pad2–/– mice after 24 hours (n = 5/group). (B and C) Concentrations of IL-1α (B) and TNF-α (C) in peritoneal lavage of WT and Pad2–/– mice after 24 hours (n = 3–7/group). (D–F) Representative Western blot images and densitometry quantification of Caspase-11 activation in lung tissues (D and E) and HMGB1 concentration in peritoneal lavage of WT and Pad2–/– mice (D and F) after 24 hours. Western blot images are representative of at least 3 independent experiments. Data are expressed as mean ± SEM. Data with 2 groups were analyzed using unpaired 2-tailed Student’s t test (A). Data with 3 or more groups were analyzed by 2-way ANOVA with Bonferroni’s multiple comparisons test (B, C, E, and F). *P < 0.05, ***P < 0.001, ****P < 0.0001.

