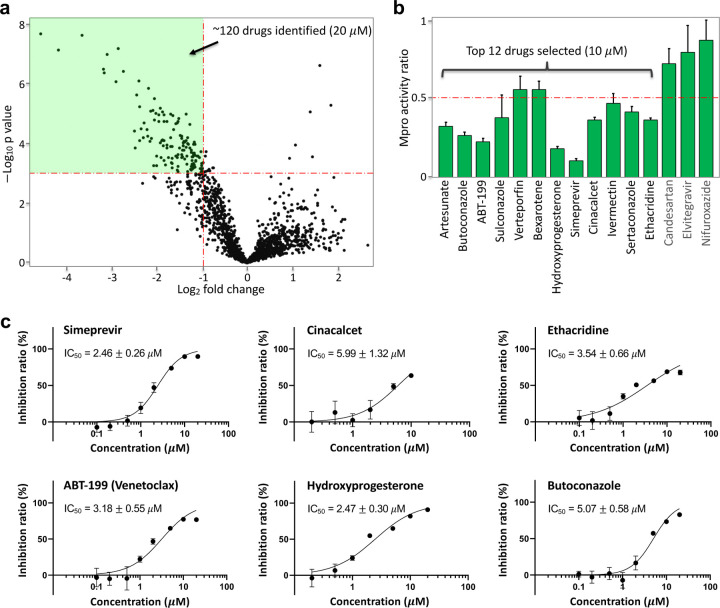
Fig. 2. High-throughput screening and drug identification using FlipGFPMpro in living cells.
(a) Volcano plot of 1622 FDA-approved drugs (20 μM) in inhibiting Mpro. HEK293T cells were transfected with FlipGFPMpro, mCherry and Mpro. FlipGFP fluorescence was normalized to co-expressed mCherry. (b) Normalized ratio of Mpro activity in drug (10 μM) vs DMSO-incubated cells for the third-round validation. The Mpro activity was determined as FlipGFP fluorescence normalized to mCherry. The ratio of Mpro activity was calculated by normalizing Mpro activity with that of cells treated with DMSO. Data are mean ± SD (n = 5). The 15 drugs were identified from a second-round imaging of the 120 identified drugs (20 μM, Extended data Fig. 1). (c) Dose-response curve of top six drugs in inhibiting Mpro. Inhibition ratio was calculated as (1-(ratio of Mpro activity)) × 100%. IC50 was represented as mean ± SEM (n = 5). See Extended data Fig. 2 for the other six drugs.

