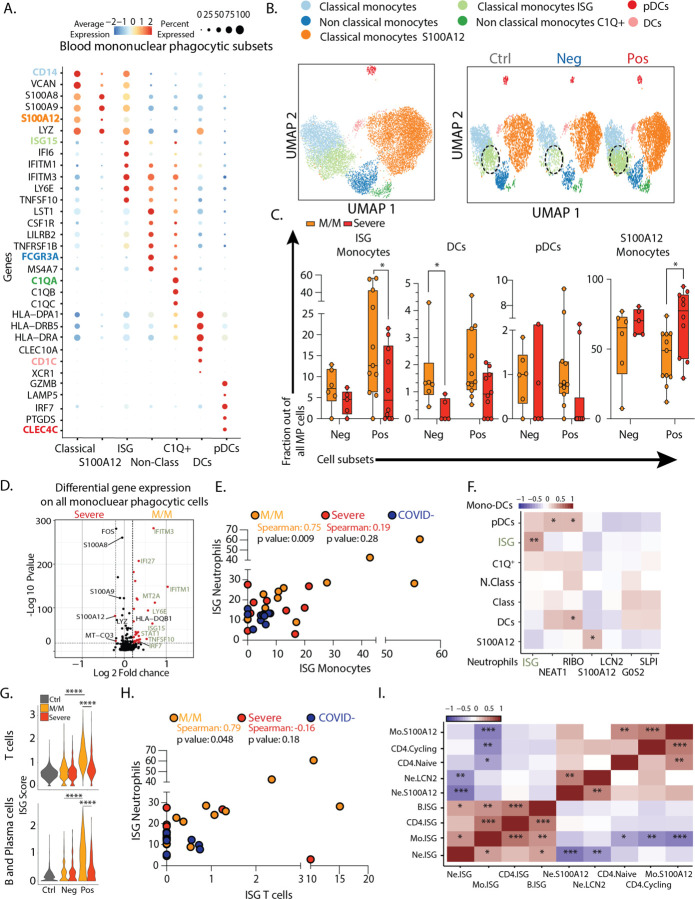
Figure 2: Severe COVID-19 disease is defined by the lack of a concerted IFN-response across peripheral blood immune cells.
A. Dotplot representation of the top differentially-expressed-genes (DEG) between clusters identified in blood mononuclear phagocytic cell (MPC) subsets. B. UMAP visualization of the 19,289 MPC isolated from the entire dataset (left) and splitted by SARS-CoV-2 status (right). C. Frequencies of MPC subsets among all MPC across control, mild/moderate (M/M) and severe individuals D. Volcano plot showing results of differential gene expression (DGE) analysis performed on all MPC between mild/moderate (right) and severe (left) patients. E. Scatter plot between neutrophil and monocyte ISG positive subsets patient by patient. F. Correlation matrix using Spearman Rank Correlation between the frequency of all neutrophils and monocytes subtypes in all SARS-CoV-2 negative and SARS-CoV-2 positive patients. (n=32) G. Violin plot of ISG signature on all T cells (top) and all B/Plasma cells (bottom) across SARS-CoV-2 status and disease severity. H. Scatter plot between neutrophil and CD4 T cell ISG positive subsets patient by patient. I. Correlation matrix using Spearman Rank Correlation between the most and the least correlated cell subsets to the Neutrophils ISG positive cells (data include all SARS-CoV-2 negative and positive patients). Statistical significance was assessed using Spearman method (n=32) (G.) Kruskal Wallis test with multiple comparisons (C.). * p-value < 0.05; ** p-value < 0.01; *** p-value < 0.001; **** p-value < 0.0001.

