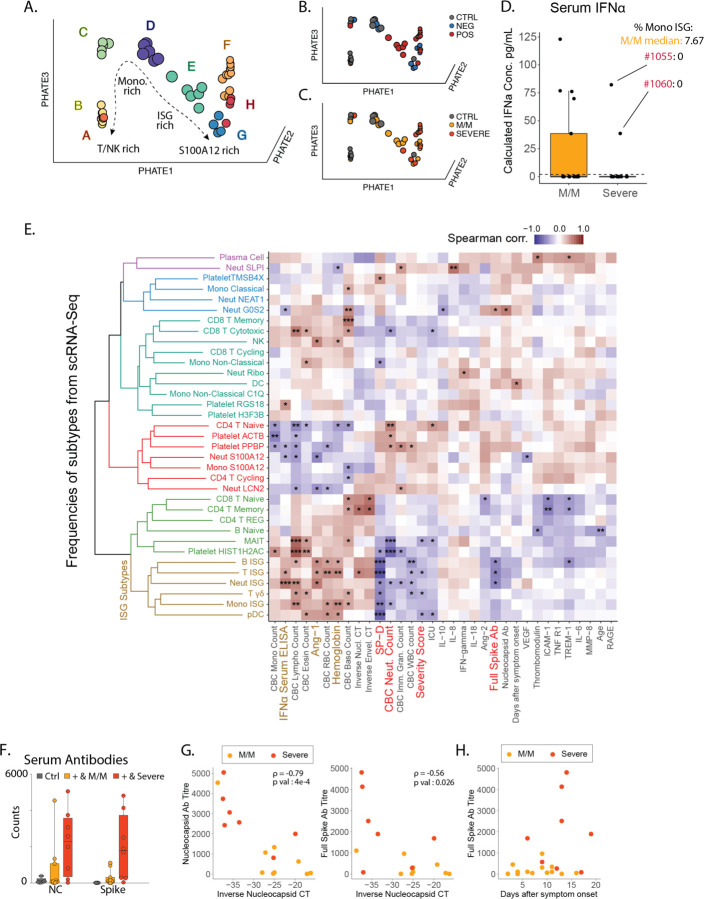
Figure 4: Integrated view of Blood Composition in COVID-19 Patients.
A-B. 3D PhEMD embedding of all patients, colored by A. de novo patient clusters A-H, B. SARS-CoV-2 status, and C. disease severity. D. Measurement of serum IFNα concentration from SARS-CoV-2 positive and negative patients by ELISA. Patients 1055 and 1060 are highlighted in red and their Monocytes ISG frequency from Fig 2C is noted as well as the median for mild COVID-19 mild/moderate patients. E. Matrix of Spearman correlation coefficients between all subtype frequencies (out of major cell types, e.g. Neut ISG out of all Neutrophils) obtained from scRNA-Seq versus patient metadata, viral load, Ab titers, and serum analyte levels on a patient-by-patient basis excluding healthy controls. Patients for which data were unavailable were excluded from correlation analysis for each comparison. Variables on both axes were ordered via hierarchical clustering with the computed dendrogram displayed for subtype frequencies. This dendrogram was divided into 6 groupings with the one containing ISG+ subtypes highlighted in brown. Clinical variables generally correlated with severity highlighted in red and anti-correlated in brown. (n for correlation comparisons ranged from n=14 to 32) * p<0.05, ** p<0.005, *** p<0.0005. F. Measurement of anti-SARS-CoV-2 antibody levels in serum from patients by Luminex assay (M/M: Mild/Moderate). G. Scatter plots showing viral load versus levels of antibody binding SARS-CoV-2 Nucleocapsid and Full Spike protein for patients in the cohort with severity overlaid. Antibody levels are shown as arbitrary units of MFI from Luminex assay while viral load is represented by an inverse CT number from QRT-PCR with target amplification of the SARS-CoV2 Nucleocapsid sequence. Correlation coefficient and significance calculated using Spearman’s method. Patients for which data was unavailable were excluded. (n=16) H. Scatterplot for SARS-CoV2 Full Spike protein antibody titers relative to days post symptom onset. Patients for which data was unavailable were excluded. (n=22)

