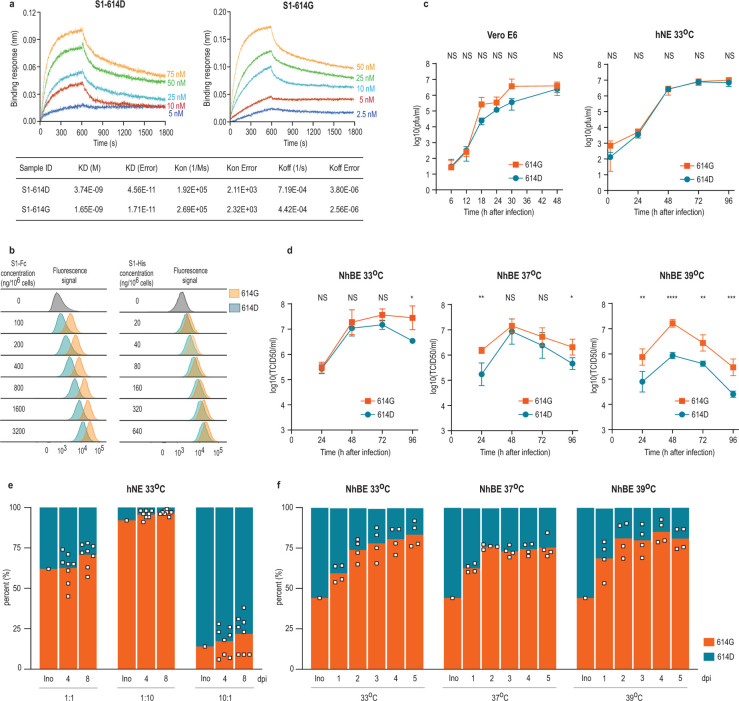
Figure 1. In vitro characterization of S1 proteins and recombinant SARS-CoV-2S−614D and SARS-CoV-2S−614G viruses.
(a) Affinity between S1 and hACE2 determined by Bio-layer interferometry. Biotinylated S1 protein (S1–614D or S1–614G) was loaded onto surface of streptavidin biosensors. Association was conducted using hACE2 protein followed by dissociation. (b) Binding of Fc-tagged or polyhistidine-tagged S1 to BHK-hACE2 cells is shown as peaks of fluorescence detected by flow cytometry. (c) Replication kinetics of recombinant viruses in (left) Vero E6 at 37°C and (right) hNE at 33°C. Supernatant was collected at indicated time points and titrated by plaque assay. Data represent the mean ± s.d. of three replicates (Vero E6) and four replicates (hNE). (d) Replication kinetics of recombinant viruses in NhBE at 33°C (left), 37°C (middle) and 39°C (right). NhBE were infected with 100,000 PFU of each virus. Supernatants were collected daily and titrated by TCID50 assay. Data represent the mean ± s.d. of four replicates. (c-d) Statistical significance was determined by two-sided unpaired Student’s t-test without adjustments for multiple comparisons. (c) P values (left to right): left, NS, P=0.9132; NS P=0.0604; NS P=0.2394; NS P=0.2389; NS P=0.2778; NS P=0.2781; right, NS P=0.1520; NS P=0.3891; NS P=0.9110; NS P=0.8985; NS P=0.1464. (d) P values (left to right): left, NS P=0.7943; NS P=0.5025; NS P=0.6683; NS P=0.8985; *P=0.0220; middle, **P=0.0065; NS P=0.4660; NS P=0.3134; *P=0.0159; right, **P=0.0094; ****P<10−4; **P=0.0028; ***P=0.0009. (e-f) Competition assay of recombinant viruses in hNE at 33°C and NhBE at 33°C, 37°C and 39°C. The inoculum was prepared by mixing two viruses at 1:1 ratio based on PFU ml−1 and used for infection of hNE and NhBE. Apical wash and supernatant were collected daily, and extracted RNA was used for sequencing. (e-f) Bar graph shows proportion of sequencing reads encoding either S-614D or S-614G, and square dots represent individual data points.

