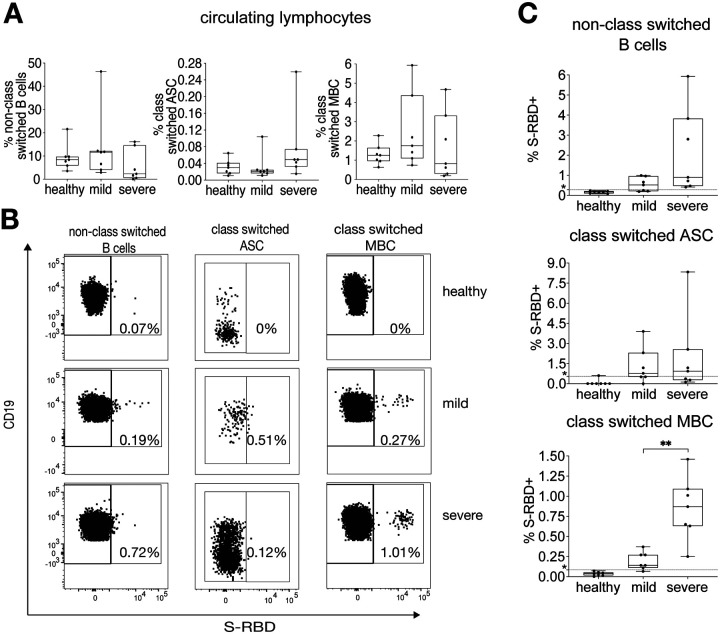
Figure 1. Quantifying S-RBD specific B cells.
(A) % of lymphocytes that are class switched MBC, class switched ASC, or non-class switched B cells in healthy, mild, and severe participants (N=7 for each group). (B) Gating strategy for S-RBD specific non-class switched B cells (CD3−, CD19+, IgD/IgM+, S-RBD+), S-RBD specific class switched MBC (CD3−, CD19+, IgM−, IgD−, CD38+/− (excluding ++), CD138−, S-RBD+), and S-RBD specific class switched ASC (CD3−, CD19+/−, IgM−, IgD−, CD38++, CD27+, S-RBD+) in “healthy” (COVID-19 negative), “mild” (COVID-19+, ambulatory), and “severe” (COVID-19+, hospitalized) participants. (C) % of class switched MBC, class switched ASC, and non-class switched B cells that are S-RBD specific in healthy, mild, and severe participants (N=7 for each group). Dotted line represents the true positive threshold, defined as the mean plus two standard deviations of the healthy group. For A and C box plots, horizontal lines indicate means, boxes are inter-quartile range, and whiskers are minimum to maximum. Three group comparisons in A were performed using one-way ANOVA, with p values adjusted for multiple comparisons using the Benjamini, Krieger and Yekutieli method. Two group comparisons in C were performed with t tests if data were normally distributed based on Shapiro Wilk normality test or Mann Whitney test if data were not normally distributed. Statistically significant comparisons are indicated (** P ≤ 0.01)

