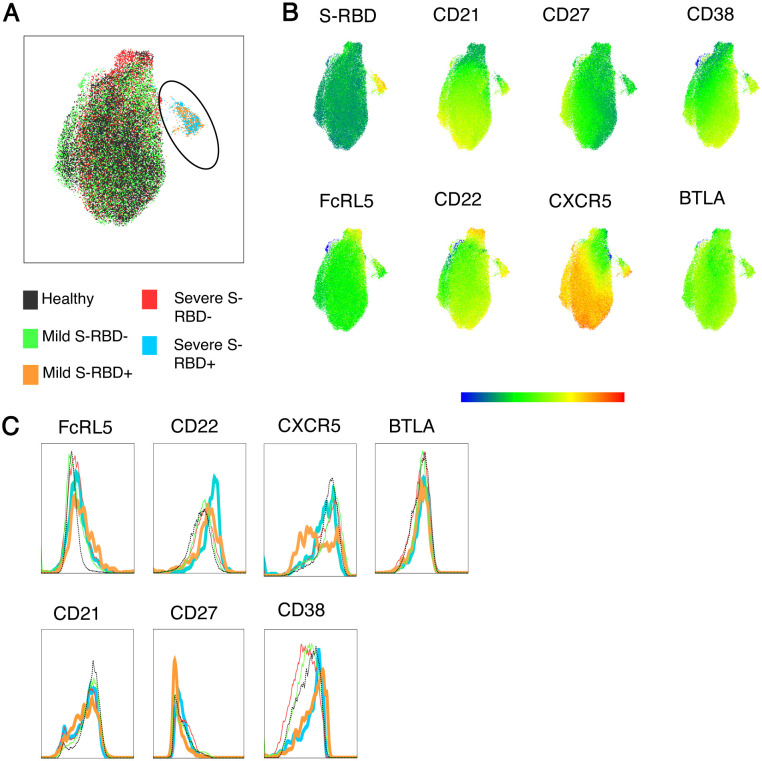
Figure 3: UMAP and histogram expression profiles of surface receptors on class switched MBC.
(A) Concatenated class switched MBC from healthy, mild, and severe subjects projected as UMAP with gated S-RBD+ class switched B cells. (B) Multigraph color mapping of the UMAP projection of S-RBD, CD21, CD27, CD38, FcRL5, CD22, CXCR5, and BTLA. (C) Overlay histograms comparing the expression of FCRL5, CD22, CXCR5, BTLA, CD21, CD27, and CD38 in S-RBD− or S-RBD+ healthy, mild and severe groups.

