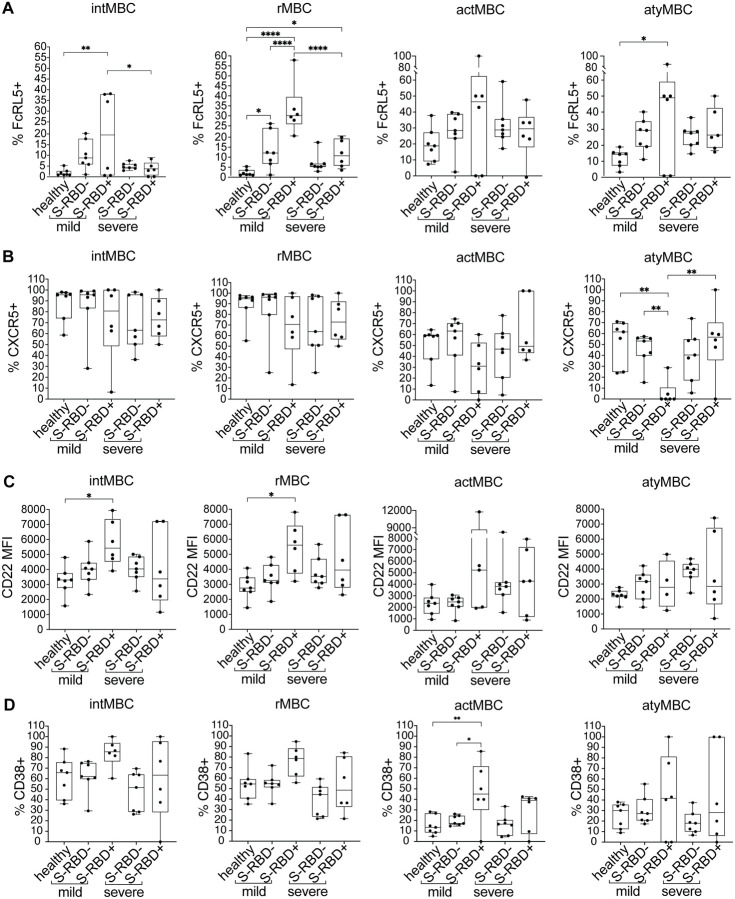
Figure 6: Surface expression of FcRL5, CXCR5, CD22, and CD38 on S-RBD nonspecific (S-RBD−) or S-RBD specific (S-RBD+) class switched intMBC, rMBC, actMBC, or atyMBC from healthy, mild, or severe participants. Expression is shown as either percent of cells positive or the mean fluorescent intensity (MFI).
(A) FcRL5 (B) CXCR5 (C) CD22 (D) CD38. For box plots, horizontal lines indicate means, boxes are inter-quartile range, and whiskers are minimum to maximum. Groups were compared by one-way ANOVA with p values adjusted for multiple comparisons using the Benjamini, Krieger and Yekutieli method. Statistically significant comparisons are indicated (* P ≤ 0.05, ** P ≤ 0.01, *** P ≤ 0.001, **** P ≤ 0.0001).

