

Abstract
The increased expression of vascular endothelial growth factor (VEGF) and its receptors is associated with angiogenesis in a growing tumor, presenting potential targets for tumor-selective imaging by way of targeted tracers. Though fluorescent tracers are used for targeted in vivo imaging, the lack of photostability and biocompatibility of many current fluorophores hinder their use in several applications involving long-term, continuous imaging. To address these problems, fluorescent nanodiamonds (FNDs), which exhibit infinite photostability and excellent biocompatibility, were explored as fluorophores in tracers for targeting VEGF receptors in growing tumors. To explore FND utility for imaging tumor VEGF receptors, we used click-chemistry to conjugate multiple copies of an engineered single-chain version of VEGF site-specifically derivatized with trans-cyclooctene (scVEGF-TCO) to 140 nm FND. The resulting targeting conjugates, FND-scVEGF, were then tested for functional activity of the scVEGF moieties through biochemical and tissue culture experiments and for selective tumor uptake in Balb/c mice with induced 4T1 carcinoma. We found that FND-scVEGF conjugates retain high affnity to VEGF receptors in cell culture experiments and observed preferential accumulation of FND-scVEGF in tumors relative to untargeted FND. Microspectroscopy provided unambiguous determination of FND within tissue by way of the unique spectral shape of nitrogen-vacancy induced fluorescence. These results validate and invite the use of targeted FND for diagnostic imaging and encourage further optimization of FND for fluorescence brightness.
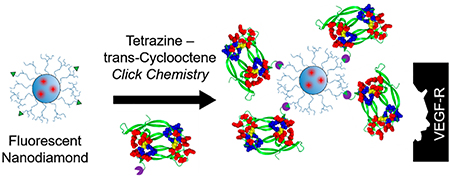
Graphical Abstract
INTRODUCTION
Though fluorescence imaging plays a powerful role in research development and clinical diagnostics,1–5 the limited photostability and biocompatibility of current fluorophores constrain potential applications (e.g., longitudinal studies of cellular dynamics or continuous, long-term surgical imaging). In contrast, fluorescent nanodiamonds (FNDs) display true infinite photostability,6–9 and their biocompatibility is well-established.10–12 The advantages of FND have been explored in numerous applications, from fluorescence imaging to advanced sensing13–15 and testing in several animal models.8,16–18 However, to date, FNDs have not been explored for targeted tumor imaging utilizing their intrinsic fluorescence.
Vascular endothelial growth factor A (VEGF) and its two main receptors VEGFR-1 and VEGFR-2 play important roles in normal and pathologic angiogenesis.19 Binding of VEGF to VEGFRs causes dimerization of transmembrane receptor proteins and subsequent activation of their tyrosine kinase activity within the cell, which initiates a number of signaling pathways. This signaling is critical for endothelial cell proliferation, viability, and function, regulating growth of new blood vessels (i.e., vasculogenesis and angiogenesis) and vascular permeability, as well as cell migration, inhibition of apoptosis, and recruitment of progenitor and hematopoietic cells from bone marrow to tumor.20,21 Overexpression of VEGF and its receptors is associated with a number of pathologies, including the growth of primary tumors and metastatic lesions.22–25 Importantly, VEGFR-1 and VEGFR-2 may have different roles in cancer progression,26 whereby VEGFR-2 is a particularly well-characterized marker of tumor angiogenesis,27–31 while VEGFR-1 may be involved in setting protumorigenic microenvironments and contributing to metastatic growth.32–34
VEGFRs are well-recognized as important therapeutic targets. To this end, many drugs have been and are being developed to inhibit either VEGF binding to the receptors or the tyrosine kinase activity of these receptors.32 In turn, the therapeutic relevance of VEGF receptors motivates development of various tracers for targeted imaging of these receptors.35 Considering the importance of VEGF receptors and potential translational opportunities for effective VEGFR-targeting tracers, we selected these receptors for assessing FND’s potential for targeted imaging. We hypothesized that using re-engineered VEGF as a targeting moiety, we could employ FND for selective imaging of VEGF receptors. Herein, a methodology for facile click-chemistry conjugation of VEGFR-targeting ligands, specifically an engineered single chain (sc) VEGF, to FND was developed. The functional activity of the particle-conjugated scVEGF moiety was validated in vitro, and enhanced accumulation of FND-scVEGF versus untargeted FND was observed in a murine tumor model, highlighting the potential for FND for targeted imaging in vivo.
RESULTS
FND Functionalization for Click Chemistry.
The emission spectrum for the starting FND is shown in Supplementary Figure S1. FND with a poly(glycerol) shell (FND-PG) was prepared as described previously.36–38 This shell increases the particle diameter by ~20 nm (Supplementary Figure S2) and increases the colloidal stability of FND in buffers. To activate FND-PG for the click-chemistry reaction between tetrazine and trans-cyclooctane (Scheme 1), FND-PG were functionalized with methyltetrazine (mTz) amine using carbonyldiimidazole (CDI)-mediated activation of poly-(glycerol) hydroxyl groups in FND-PG to form a carbamate linkage.39 The increase in the concentration of CDI in the reaction mixture led to the higher surface densities of conjugated mTz, which was readily visualized as an enhanced pink color in pelleted FND-mTz (Figure 1a). The chemical reactivity of FND-conjugated mTz moieties was confirmed by click-reaction (Scheme 1) with Cy5-TCO, which is blue in color. The enhanced density of conjugated mTz led to an enhanced blue color in pelleted FND-Cy5 (Figure 1b). UV-vis absorption spectra of resuspended FND-Cy5 and control FND-PG were obtained after removal of background Rayleigh particle scattering by polynomial subtraction (Figure 1c). FND-Cy5 spectra, but not control FND-PG spectra, show an absorption maximum at 650 nm with CDI-dependent intensity and a shoulder at 605 nm that were due to Cy5. Smaller peaks at 560 and 585 nm were observed in samples with higher mTz densities due to absorbance from these ligands. We then used the molar absorptivity of Cy5 at 650 nm to calculate the average density of reactive mTz per particle as a result of the different CDI reaction concentrations used (27, 20, 13, and 7 mg/mL CDI). The most concentrated sample activated with 27 mg/mL CDI exhibited up to 500 mTz per particle; however, at this mTz density, colloidal stability was affected. Thus, particles with lower Cy5 measured densities (~200, 100, and 30 mTz) per particle were used for further validation or in vivo work.
Scheme 1.

Figure 1.

Validation of mTz functionalized FND. (a) Color gradient (left to right) of pink pelleted FND-mTz particles with increasing mTz surface density correlates with the increase in CDI concentration in the conjugation reaction mixture (7–27 mg/mL). (b) Color gradient (left to right) of blue pelleted FND-Cy5 particles prepared via click-conjugation of Cy5-TCO to FND-mTz with different mTz surface density from Figure 1a. (c) UV-vis spectra of resuspended FND-Cy5 prepared from FND-mTz with different mTz surface density determine by concentration of CDI during preparation of FND-mTz (Contribution from Rayleigh scattering particles subtracted by polynomial subtraction).
Biocompatibility and Functional Activity of Derivatized FND in Tissue Culture.
Three preparations of FND-mTz with approximate mTz surface densities of 30, 100, and 200 mTz/FND, named FND-mTz Low, Middle, and High, were prepared as described above and used in tissue culture experiments. Although all FND-mTz formed dense precipitates on the cell surface, 293/KDR cell growth was not affected in the concentration range of 1–350 pM FND-mTz (Figure 2A). This is in agreement with the results previously reported for poly(glycerol) covered FND that were tested with colony forming endothelial cells (ECFCs).38
Figure 2.

(a) FND-mTz with various mTz surface density do not affect 293/KDR cell viability (low, mid, and high, respectively, 30, 100, and 200 mTz/FND); (b) SDS-PAGE analysis of scVEGF-TCO conjugation to FND-mTz. Lane 1: total amount of scVEGF-TCO. Lane 2–4: unreacted scVEGF-TCO left after Medium, Low, and High density FND-mTz. Lane 5: Control tetrazine agarose. Lane 6–8: amount of scVEGF-TCO coming off FND-scVEGF particles with high salt wash. Lane 9: control tetrazine agarose after high salt wash.
For targeting VEGF receptors, preparations of FND-mTz with different surface density of mTz were functionalized with scVEGF-TCO, an engineered single-chain version VEGF121 expressed with N-terminal cysteine-containing tag (Cys-tag), which was site-specifically derivatized with TCO. Click reactions were performed at concentrations of scVEGF-TCO twice higher than calculated mTz concentrations. As a positive control for such reaction, we used agarose-Tz beads (Ag-Tz). After pelleting all FND from click-reaction mixtures, SDS-PAGE of supernatants indicated a significant decrease in the amounts of free scVEGF-TCO relative to the input scVEGF-TCO (compare intensity in lane 1 and lanes 2–5 in Figure 2b). Virtually no scVEGF-TCO was detected in high-salt washes of the corresponding pellets (lanes 6–9 in Figure 2b), indicating that association of scVEGF with FND was not due to a nonspecific binding of scVEGF-TCO to pelleted FND-mTz or Ag-Tz.
The amount of scVEGF-TCO click-conjugated to FND-mTz with different mTz surface density was estimated in two different assays. First, the upper limits of conjugated scVEGF-TCO was determined from the intensities of the residual scVEGF-TCO bands vs the intensity of the input scVEGF-TCO band and was found to be in the range of 200–300 scVEGF/FND depending on initial mTz surface density in FND-mTz (Table 1). However, considering that not all surface-bound scVEGF-TCO can be simultaneously spatially accessible for interactions with the cellular VEGF receptors, we used a sandwich enzyme-linked immunosorbent assay (ELISA) to assess the fraction of scVEGF in FND-scVEGF that was capable of interacting with other proteins. Using free VEGF to calibrate ELISA, we found that the number of scVEGFs per FND that was responsible for binding of anti-VEGF antibodies to plate-bound FND-scVEGF was at least an order of magnitude lower than the total estimated amount of scVEGF per FND (Table 1).
Table 1.
scVEGF Concentrations As Determined by ELISA and Compared to SDS-PAGE
| sample | scVEGF per FNDby SDS-PAGE | scVEGF per FND by ELISA |
|---|---|---|
| non-derivatized | none | none |
| FND-scVEGF Low mTz | 230 | 6 |
| FND-scVEGF Mid mTz | 278 | 21 |
| FND-scVEGF High mTz | 307 | 40 |
Next, we tested FND-scVEGF preparation with the highest scVEGF per FND, as determined by ELISA, in the cell protection assay that was previously developed for characterization of scVEGF and its conjugates. In this 72-h assay, scVEGF-conjugates are tested for their ability to protect VEGFR-2 overexpressing 293/KDR cells from VEGFR-2 mediated cytotoxicity of Shiga-like-toxin (SLT)-VEGF fusion toxin containing Shiga-like toxin enzymatic subunit A genetically fused to VEGF121 isoform.40 The morphology of 293/KDR cells exposed to SLT-VEGF changes dramatically from a normal growing monolayer of cells to few clusters of dying cells (Figure 3a, upper left panel). As expected, untargeted FND-mTz did not rescue cells (Figure 3a, upper right panel). In contrast, we found that FND-scVEGF, but not FND-mTz, protected cells from cytotoxic SLT-VEGF in a dose-dependent manner (Figure 3a, lower panels, and Figure 3b). For dose-dependence analysis, we used the ELISA-based determination of ~40 accessible scVEGF moieties per FND. This surface density of accessible scVEGF led to a calculated EC50 for FND bound scVEGF of 3.5 nM, while EC50 for free scVEGF was 2 nM.
Figure 3.

(a) Microscopy of cell morphology after SLT-VEGF incubation with either no competitor, 18 nM of scVEGF-TCO, FND-mTz, or 24 nM of FND-scVEGF with ELISA determined ~40 “accessible” scVEGF per FND, as compared with untreated controls. Note that 293/KDR cells treated with high concentrations of scVEGF are somewhat contracted and better separated (lower left panel) than untreated cells (lower right panel), as described previously for 293/KDR cells treated with recombinant VEGF.41 (b) Dose-dependent increase in survival of SLT-VEGF treated 293/KDR cells in the presence of scVEGF, FND-scVEGF, but not FND-mTz. (c) Western blot of VEGFR-2 tyrosine autophosphorylation induced by FND-scVEGF with different surface density of scVEGF and parental scVEGF. Concentration of scVEGF was based on ELISA measurements for FND-scVEGF preparations used in these experiments. Similar amount of 293/KDR were exposed to indicated concentrations of either free or FND bound scVEGF and processed as described in Material and Methods section.
We then tested the ability of FND-scVEGF prepared with FND-mTz high and middle to activate VEGF-mediated tyrosine autophosphorylation of the VEGFR-2 receptor in 293/KDR cells engineered to overexpress VEGFR-2.40 We found that both types of FND-scVEGF were active in this assay (Figure 3c). Although FND-scVEGF were somewhat less active than free scVEGF-TCO, tyrosine phosphorylation reached saturation at nanomolar concentrations of “accessible” FND-conjugated scVEGF.
Finally, we tested cellular uptake of FND-scVEGF and control FND-PG in two primary human cell types: human endothelial colony forming cells (ECFCs, #CB002) and human foreskin fibroblasts (CCD1137). Human endothelial cells (e.g., human umbilical vein endothelial cells, human dermal microvascular endothelial cells, and human dermal lymphatic microvascular endothelial cells) express high level of VEGFR-1 and VEGFR-2, while primary fibroblasts express only low levels of VEGFR-1 and no VEGFR-2.42–44 Microscopy revealed readily detectable colocalization of FND-scVEGF, but not untargeted FND-PG with ECFCs, though were not present in nuclei (Figure 4a, Supplementary Figure S3). Although the intensity of FND-scVEGF per cell was variable, virtually all cells showed dose-dependent FND-scVEGF association, with saturation at ~2 pM (Supplementary Figure S4). Interestingly, the association of targeted FND-scVEGF was also readily detectable in experiments with CCD1137 fibroblasts, which express only low level of VEGFR-1 receptors. However, quantitative analysis of fluorescence intensity indicated a higher binding of FND-scVEGF in ECFCs (CB002) as compared to fibroblasts (CCD1137) (Figure 4B). Of note, the differential association of FND-scVEGF by ECFCs and CCD1137 was more prominent at higher FND-scVEGF concentrations (Supplementary Figure S5).
Figure 4.

(A) representative images of ECFCs treated with FND-scVEGF or control (FND-PG) at 4 pM. The cells were treated for 3 h, washed, and imaged with INCell 2200 high content imager. λex FND 475 nm, λem FND 679 nm. 5-Carboxyfluorescein diacetate was used as viability stain. (B) Concentration-dependent uptake of VEGFR-targeted FND or control FND in EFCF CB002 and CCD-1137 fibroblasts, which display differing amounts of VEGFR (n = 3, 6 images analyzed/well).
Imaging of FND-scVEGF Accumulation in Tumors.
Tumor-bearing mice were injected with targeted FND-scVEGF and untargeted FND-PG. Though whole-body imaging of mice was attempted, significant visualization of FND uptake over time with the particle size studied (140 nm) was not possible. To characterize tracer uptake, tumors were harvested, cryosectioned, and investigated by epifluorescence microscopy, with representative images shown in Figure 5A–C. Tumors harvested from FND-scVEGF injected mice showed increased fluorescence as compared to untargeted FND-PG control (Supplemental Figure S6). Quantitative analysis of cryosections revealed a significantly higher density of FND in tumors from animals injected with targeted FND-scVEGF relative to those from animals injected with untargeted FND-PG (p < 0.0075) and to control (p < 0.0055) (Figure 5D). Note that for analysis, thresholding was performed to discriminate against background and artifact fluorescence; artifact signal not overlapping with tissue was not counted.
Figure 5.

Tumor cryosection fluorescent images from each group A) Control (no particles, n = 3), B) FND-PG (n = 5), C) FND-scVEGF (n = 4). Overlay channels correspond to brightfield (gray), DAPI (blue), and FND (red). (D) analysis of particle amount as compared to tumor area. Background is negated for clarity.
In a separate imaging setup, the FND origin of this fluorescence was then confirmed with microspectroscopy, whereby presence of FND nitrogen-vacancy center signals, specifically readily detectable zero phonon lines at 575 and 648 nm were analyzed (Figure 6). Additionally, red fluorescence was detected under both blue (470/28 nm) and green (517/20 nm) excitation. The long Stokes shift under blue excitation exhibited by red FND fluorescence was useful in discriminating against background fluorescence. Generally, particle clustering was most readily observed toward the periphery of the tumor section, with particles less readily visible toward the center (Supplementary Figure S7). Particles were visible at all explored objectives (10×, 40×, and 100×); however, 40× and 100× gave the most apparent contrast.
Figure 6.

Validation of FND localization in tumors via microspectroscopy. Images of cryotomed sections of tumors from mice administered either FND-PG (nontargeted), FND-scVEGF (targeted), or vehicle (no particles) are shown. Channels include bright field, blue excitation, and green excitation. Emission spectra are shown for 532 nm illumination, positively identifying nanodiamond only in the scVEGF conjugated sample.
Though there was significantly lower uptake of untargeted FND-PG with fluorescence only slightly above background, it is important to note the presence of untargeted FND-PG could be detected. Sensitivity of detection of untargeted FND-PG uptake was improved by rastering a 532 nm laser focused as a point illumination source. When doing so, homogeneous and fine point sources of FND fluorescence could be observed throughout the tumor in a speckled pattern at 100× magnification. This distribution was entirely different from that of FND-scVEGF and was not present in the control sample. Due to the low contrast and homogeneous visualization of FND-PG, it was difficult to obtain either images or spectra, however in some events it was possible to confirm these were indeed FND (Supplementary Figure S8). This difference in fluorescence contrast agreed with the non-significant increase in signal from untargeted FND as compared to control, as observed in Figure 5D. Interrogation of FND-scVEGF administered samples under 100× objective displayed what appeared to be ordered clustering (Supplementary Figure S9). Finally, tumor sections were imaged via two-photon imaging with 810 nm excitation, again confirming particles present only in the targeted sample (Supplementary Figure S10).
DISCUSSION
In this study, we report the development of FND that are functionalized with scVEGF-TCO for targeting VEGF receptors. To facilitate FND functionalization through a standardized and facile procedure, we used FND-PG-FND coated with a uniform hydroxylated surface provided by poly(glycerol).36–38 This coating provides not only readily derivatizable hydroxyl groups but also an enhanced colloidal stability in buffers and elevated ionic strength. In turn, FND-PG was used for synthesis of FND-mTz, where methyltetrazine moieties (mTz) provide for rapid, catalyst-free, room temperature click-chemistry reaction with TCO. We found that the surface density of mTz in FND-mTz can be conveniently controlled by changing concentration of CDI used for the activation of hydroxyl groups in FND-PG for reaction with the mTz amino group (Figure 1). Importantly, in 72-h tissue culture cytotoxicity assay, FND-mTz was not toxic to 293/KDR cells up to concentrations as high as 350 pM. These results are consistent with a growing body of literature that support that FND display strong biocompatibility.10–12
To estimate the surface density of the accessible and reactive mTz, we used a click-reaction between FND-mTz and Cy5-TCO, a cyanine dye with the high molar absorptivity at wavelength longer than 600 nm, where scattering from FND is minimized. Using this method, we could correlate mTz densities up to 500 mTz moieties on the FND-mTz surface based on the CDI concentration used. The highest levels mTz densities, however, showed diminished colloidal stability. Thus, for further validation, particles with densities around 200 mTz per FND and lower were used.
To assess functionalization of FND-mTz with targeting protein scVEGF-TCO, we used several complementary approaches. SDS-PAGE analysis of the scVEGF-TCO-FND-mTz reaction mixture was used to determine a decrease in free scVEGF-TCO after click-reaction. Since we found that the contribution of nonspecific binding scVEGF-TCO to FND-mTz was negligible, such SDS-PAGE analysis provided an upper limit estimation for the overall amount of scVEGF on FND-scVEGF surface, ~300 scVEGF/particle, which is in accordance to the number found by click-reaction with Cy5-TCO. On the other hand, we have used an ELISA sandwich assay with antibodies against different VEGF epitopes to determine the presence of “accessible” scVEGF on FND-scVEGF surface. We reasoned that since the plate-captured unit is the entire FND-scVEGF particle, only the accessible scVEGF on the side opposite to captured surface (i.e., not all scVEGF on the particle) can be detected with the second antibody. Indeed, using free scVEGF-TCO for calibration, we found that ELISA assay yields approximately 30 scVEGF per particle, or 10-fold lower than estimations based on Cy-TCO reaction or SDS-PAGE analysis of reaction mixture.
Despite this disagreement, the ELISA result on the “accessible” scVEGF appears to provide a better estimation for the surface scVEGF moieties that are capable of interacting with VEGF receptors. In two different cell-based assays, (i) induction of cellular VEGFR-2 tyrosine autophosphorylation and (ii) protection against SLT-VEGF VEGFR-2 mediated cytotoxicity, dosing based on ELISA results yielded activities per conjugated scVEGF close to that of free scVEGF (Figure 3). This agreement between cell-based and ELISA assay is not surprising, considering that topologically each FND-scVEGF nanoparticle can utilize only a limited number of cell-surface scVEGF moieties for binding to cellular VEGFR-2 receptors. However, we cannot exclude the possibility that in addition to accessibility, surface-bound scVEGF could be functionally inactivated through some additional mechanisms.
To assess the imaging potential of FND-scVEGF, we tested their ability to selectively accumulate in tumors was explored in a 4T1 mouse tumor model. We found that intravenous injection of targeted FND-scVEGF resulted in their significant tumor uptake (Figures 5 and 6). A positive identification of tissue-captured FND can be made through several methodologies, (i) red fluorescence under blue excitation, (ii) deeper (longer) red fluorescence under green excitation, (iii) pinkish/red coloration under UV illumination, (iv) lack of photobleaching after prolonged illumination, and (v) spectral confirmation with laser excitation. The highest density of FND-scVEGF was found at the periphery of the tumor, in the area known as the angiogenic edge with highest density of angiogenic vasculature and, correspondingly, highest density of VEGF receptors. Similar preferential accumulation of scVEGF-based tracers in angiogenic tumor edge has been reported previously.45 As expected, untargeted FND-PG injected in tumor-bearing mice were also found in tumors. Nanoparticles are known to accumulate in tumors through leaky vasculature via nonspecific enhanced permeability and retention mechanism.46 However, the distribution of FND-PG accumulation was distinct from that of FND-scVEGF. The FND-PG particles that were present were spread homogeneously, in contrast to FND-scVEGF and could only be seen with laser rastering to observe small, individual point sources of light, which also appeared to a greater degree toward the tumor periphery as characterized by leaky angiogenic vasculature. Moreover, unlike FND-scVEGF, untargeted FND-PG did not display any clustering tendency and were difficult to visualize under broad illumination indicating low uptake. Supplementary Figure S8 highlights an example where they could be seen. It is important to note that spectra of FND within tissue (Figure 6) do not resemble exactly spectra alone (Supplementary Figure S1). The contribution from tissue autofluorescence artificially raises the seeming contribution from NV0 (575 nm). Though this does not directly affect standard fluorescent measurements, the presence of spin sensitive NV− allows for signal enhancing possibilities techniques like optically detected magnetic resonance.16,47
A beneficial outcome of targeting endothelial cells is that particles need not extravasate tissue for successful labeling. The selective accumulation of FND-scVEGF suggest that use in clinical applications for the labeling of tumor margins could be significantly advantageous. Furthermore, photostable characteristics of FND-scVEGF could be particularly useful in longitudinal studies of tumor progression. The field of multiphoton microscopy, which uses high laser power and provides increased penetration depth due to near-infrared excitation source, is a natural field where targeted FNDs’ unique photostability would be especially applicable.
CONCLUSIONS
Fluorescent nanodiamonds (FND) were functionalized with re-engineered vascular endothelial growth factor scVEGF, which retain its ability to bind to cellular VEGF receptors. Facile click-chemistry functionalization was achieved via using FND coated with poly(glycerol) and derivatized with click-chemistry reagent mTz, while scVEGF was site-specifically derivatized with its click-chemistry partner, TCO. Conjugation of scVEGF was validated in vitro by SDS-PAGE, ELISA, and binding of FND-scVEGF to VEGFR-2 receptors was validated in functional tissue culture assays with VEGFR-2 overexpressing cells. In tumor-bearing mice, targeted FND-scVEGF accumulates in tumor angiogenic edge in readily detectable pattern, distinctive from the lower nonspecific accumulation of untargeted FND. These results validate and invite the use of targeted FND for diagnostic imaging and encourage further optimization of FND for fluorescence brightness.
MATERIALS AND METHODS
Materials. The sources of main chemicals were as follows: fluorescent nanodiamond (140 nm) of high-temperature, high-pressure origin (NDNV140nmHi, Adámas Nanotechnologies, Inc.) was produced by irradiation with 3 MeV electrons of starting diamond powder and annealed at 850°C according to reported procedures38 and contains 3 ppm of NV centers according to EPR measurements.48 Their fluorescence spectra and size distribution are provided in Supplementary Figure S1 and S2. Additionally used were dimethylformamide (DMF, Sigma-Aldrich), carbonyldiimidazole (CDI, Sigma-Aldrich), glycidol (Sigma-Aldrich), methyltetrazine-PEG4-amine (mTz-PEG-NH2, Click Chemistry Tools), Cy5-transcyclooctene-(Cy5-TCO, Click Chemistry Tools), tetrazine agarose (Click Chemistry Tools), Dextrose (American Brewmaster Raleigh), SDS-PAGE (SibTech), VEGF enzyme-linked immunosorbent assay (ELISA, R&D Systems), and Cell Titer Assay (Promega). Cell lines used include human foreskin fibroblasts CCD-1137Sk (ATCC CRL-2703), human endothelial colony forming cells (ECFCs, clone #CB002, Creative Scientist, Inc.), and KDR293 cells (SibTech, Inc.).
Nanodiamond Click Chemistry and VEGF Reagent Synthesis.
Methyltetrazine (mTz) functionalized FND (FND-mTz) was synthesized by coupling mTz-PEG-NH2 to previously described poly(glycerol) coated FND (FND-PG).36–38 Briefly, hydroxylated FND, produced by reduction with lithium aluminum hydride,49 was reacted in neat glycidol at 140°C for 2 h followed by washing via centrifugation to produce FND-PG with high colloidal stability in aqueous buffers and solutions of elevated ionic strength. FND-PG was then transferred to DMF by centrifugation and resuspension. Hydroxyl groups of PG were then activated by addition of CDI stocks (10–40 mg/mL in DMF) to 1 mg/mL solutions of FND-PG in anhydrous DMF, producing a range of final CDI concentrations (6.6–26.6 mg/mL) for testing. After 1-h activation at room temperature, FND-PG particles were pelleted and washed once with DMF. Activated FND-PG were then resuspended in an aqueous solution of mTz-PEG-NH2 (0.9 mg/mL, DI) and allowed to react overnight. Particles flocculated by the following next day, and the resulting FND-mTz were pelleted and washed three times with an H2O/DMF mix (3:1). For validation, particles suspended in DI were incubated with excess Cy5-TCO, washed 4x, and analyzed via UV-vis (PerkinElmer Lambda 35). Particles at the highest mTz density showed some degree of instability with time. Thus, to compromise between mTz density and stability, the particles activated with CDI concentration at 17 mg/mL were used for in vivo administration.
scVEGF (SibTech, Inc.), a 241 amino acid single-chain (sc) variant of vascular endothelial growth factor (VEGF), comprising two 3–112 fragments of VEGF121 cloned head-to-tail and N-terminal 15-aa cysteine-containing tag, was site-specifically derivatized on C4 with TCO-PEG3 -maleimide (Click Chemistry Tools), as described previously for various payloads.40,50 For click-reaction, FND-mTz was concentrated, and a working stock of scVEGF-TCO in PBS/1%DMF was added to FND-mTz to a final concentration 2x relative to the expected mTz concentration (estimated from UV-vis analysis). In addition, a positive control of Agarose-Tz was similarly exposed to scVEGF-TCO. Samples were incubated 30 min at RT with agitation. Particles were spun down (5k rpm, 5 min), and supernatant was analyzed by SDS-PAGE. Particles were then resuspended in 0.5 mL of 0.5 M NaCl in PBS to desorb nonspecifically bound scVEGF-TCO and then spun down (5k rpm, 5 min), and supernatant was analyzed by SDS-PAGE. Finally, pellets were suspended in 100 μL of sterile PBS and stored at 4°C.
ELISA.
A commercial ELISA assay (R&D Systems) for VEGF was used for assessing FND-conjugated scVEGF. FND-scVEGF was captured on a plate coated with the primary anti-VEGF antibody, after which the amount of available scVEGF was determined by incubation with the secondary anti-VEGF antibody. A calibration curve was obtained with a VEGF standard according to manufacturer’s instructions. The linear approximation of the calibration curve was used to calculate VEGF concentration in titrated FND-scVEGF samples. In addition to FND-scVEGF, nonderivatized FNDs were assayed alongside to determine level of potential nonspecific antibody binding to FND.
In Vitro Cell Viability.
FND-mTz cytotoxicity was tested using 293/KDR cells (SibTech, Inc.), which are VEGFR-2 overexpressing derivatives of human embryonic kidney cells HEK293. Cells were plated on a 96-well plate at 2000 cell/well. After 20 h, 0.25 pmol FND-mTz were resuspended in culture medium (DMEM with 2 mM Glutamine, 10% FBS, antibiotic/antimycotic mixture) and serially diluted in complete culture medium at a range of concentrations from 1–350 pM (1–350 ug/mL) and added to cells. After incubation under normal culture conditions for additional 72 h, the number of viable cells was determined by CellTiter assay and cell viability was expressed as percentage compared to control (nontreated) cells.
Shiga-Like-Toxin VEGF Competition Assay.
Once the absence of intrinsic toxicity of FND to 293 KDR cells was confirmed, VEGF activity of FND-scVEGF was tested using a competition assay between FND-scVEGFs and a cytotoxic VEGF-toxin fusion protein: SLT (Shiga-like toxin)-VEGF. Upon binding to VEGFR-2, SLT-VEGF initiates receptor-mediated endocytosis and enters the cell, killing VEGFR-2 expressing cells after 24–48 h of exposure to 2 nM of SLT-VEGF.51 The competition assay is based on the ability of scVEGF-based constructs to compete with SLT-VEGF for VEGFR-2. The efficiency of protection for scVEGF-based constructs is characterized by an EC50 value, determined from dose-dependent protection experiments. Values of EC50 for derivatized scVEGF are compared to that of parental scVEGF, to assess how derivatization affected scVEGF binding to VEGFR-2.40 Derivatized and nonderivatized FND were pelleted and resuspended in 2 nM SLT-VEGF. After 20 h of plating cells, serially diluted samples were incubated with the culture, in addition to 2 nM SLT-VEGF. After 96 h, cell viability was determined by CellTiter assay and compared to controls. In this experiment, we consider that only scVEGF detected by ELISA would be accessible to the cellular receptors.
VEGFR-2 Tyrosine Kinase Autophosphorylation in VEGFR-2 Overexpressing Cells.
The binding of VEGF activates VEGFR-2 tyrosine kinase activity that leads to autophosphorylation detectable by Western blot analysis. The advantage of this assay as that it is short, sensitive, and specific. Five minutes incubation of 293/KDR cells with VEGF is enough to detect phosphorylated tyrosine residues in VEGFR-2. Moreover, low nanomolar VEGF is sufficient to reliably detect its functional activity. Finally, antibodies to every phosphorylated tyrosine in the cytoplasmic tail of VEGFR-2 are commercially available.
293/KDR cells were plated into 24-well plates, 7.5 × 10⁴ cells/well, and incubated for 20 h at 37°C in 5% CO2. FND-scVEGFs (or scVEGF Standard) were then serially diluted in complete culture medium and added to cells to final scVEGF concentrations of 0.2, 1, and 5 nM. (Concentrations of scVEGF in FND preparations were calculated based on a prior ELISA assay). After 5 min incubation at 37°C, treated and control (no VEGF) cells were lysed and the lysates were immediately loaded on a 10% polyacrylamide gel. Cell lysates were separated by SDS-PAGE and then analyzed by Western blotting with Ph-VEGFR2(pY1175) antibody specific to phosphorylated tyrosine in position 1175 of the cytoplasmic tail of VEGFR-2.
Labeling of Endothelial Colony-Forming Cells and Fibroblasts.
Validation of FND-scVEGF was also performed using human foreskin fibroblasts CCD-1137Sk (ATCC CRL-2703) and human endothelial colony-forming cells (ECFCs, clone #CB002, Creative Scientist, Inc.). ECFCs were isolated from cord blood and propagated according to previously published protocol.52 ECFCs were cultured in VecStem Media (cat. no. VSM01–250 mL, Creative Scientist, Inc.) with 2% human serum supplement (cat. no VS01–5 mL, Creative Scientist, Inc.). CCD1137 fibroblasts were cultured in DMEM (MilliporeSigma) supplemented with 10% FBS (Corning). ECFCs and CCD1137 naturally express different levels of VEGFRs, with ECFCs displaying significantly more VEGFR2 than CCD1137. For FND association studies, cells were plated at 2000/well density in a 384-well plate. The following day, targeted and control FND were added to the cells at final concentrations of 4, 2, 1, 0.5, and 0.25 pM in triplicate wells and incubated for 3 h at 37°C. The cells were washed with HBSS with Ca2+ and Mg2+ (cat. no. 21–023-CV, Corning) and incubated with 1.5 μM 5-Carboxyfluorescein diacetate (cat. no. C4916, MilliporeSigma) and with 1.5 μg/mL Hoechst 33342 (cat. no. H7399, Thermo Scientific) for 15 min at 37°C in HBSS (10 μL/well). After they were washed with HBSS, live cells were imaged using 20× objective in INCA 2200 high content analyzer (GE Healthcare), with four fields of view taken per well. The images were analyzed using INCA 2200 software, and the percentage of FND-positive cells among 5-CFDA/Hoechst positive cell was identified.
Animal Model and IV Administration of FND.
Fourteen six-to-eight-week-old ~20 g athymic BALB/c female mice were sourced from Duke Cancer Center Isolation Facility and maintained in standard housing at 22°C with water. A purified, low-fluorescent diet accessed ad libitum was provided by the Duke Animal Care and Use Program. Animal care and procedures were approved by Duke University’s Institutional Animal Care and Use Committee. Mice were fed an alfalfa-free diet (AIN-76A, Research Diets, Inc., New Brunswick, NJ) to minimize background fluorescence and were allowed several weeks to adapt to this diet. 4T1 murine mammary carcinoma cells were maintained in Dulbecco’s Modified Eagle’s Media (Gibco, Gaithersburg, MI) supplemented with 10% heat-inactivated fetal bovine serum (Gibco, Gaithersburg, MI) and 1% antimycotic/antibiotic solution (Gibco, Gaithersburg, MI) in a 37°C and 5% CO2 environment. Mice were injected into the right flank with 2.5 × 10⁵ 4T1 cells in 100 μL of 1X PBS. Prior to injection, cells were washed twice with 1× PBS. The study was initiated when tumors were approximately 300 mm3.
For tail vein injection, all groups were prepared at 10 mM HEPES pH = 7.4 with 5% dextrose. The administered groups were FND-scVEGF (500 μg/mouse, N = 5), FND-PG (500 μg/mouse, N = 5), and control group (only 5% dextrose in 10 mM HEPES, N = 4) with administration volume of 200 μL. (Note: control has one mouse less due to attrition prior to administration.) Mice were sacrificed at the humane end point (tumor volume is 2000 mm3) or the end of study.
In Vivo and Ex Vivo Imaging.
Mice were imaged before injection (t = 0), as well as at several time points times post injection, t = 4, 8, 5, 48, 72 h using IVIS kinetic whole-body imaging system (Caliper LifeSciences, PerkinElmer, Hopkinton, MA), with 605 nm excitation and Cy5.5 emission window. IVIS acquisition and analysis were performed in Living Image (v. 4.3.1, Caliper LifeSciences, PerkinElmer, Hopkinton, MA). During acquisition, mice were anesthetized with 1.5% isoflurane (Henry Schein Animal Health, Dublin, OH) in pure oxygen environment and warmed on a heated stage. Mice were sacrificed after 72 h and tissue was flash frozen. Frozen tumors (stored at −280°C) were cut in half and cryotomed (FSE, Thermo Scientific, Waltham, MA) in 10-μm sections in a −25°C environment. Postsectioning, half of the samples were stained with Hoechst DAPI (bisBenzimide H 33342 trihydrochloride, Sigma-Aldrich, St. Louis, MO). Samples were warmed to room temperature in an uncovered humidity rack, then fixed in ice-cold methanol (Sigma-Aldrich, St. Louis, MO) for 10 min. Postfixation, slides were rehydrated in 1× PBS (Gibco, Gaithersburg, MI) for 5 min. Hoechst solution was applied at a concentration of 1 μg/mL and incubated at room temperature for 10 min. Hoechst-stained slides were stored in a dark, room-temperature environment, and unstained slides were stored in a −80°C freezer.
The sections were imaged using a Zeiss inverted microscope (Zeiss Axio Observer 1.0, Carl Zeiss, Thornwood, NY) with a Hamamatsu camera (ORCA-Flash 4.0, Hamamatsu Photonics, Bridgewater, NJ). Nanodiamond signal was recorded with a standard Cy5 filter set, and a DAPI filter set was used for Hoechst imaging. Imaging and preliminary analysis was performed in Zen (ZEN pro 2012 (blue edition), Carl Zeiss, Thornwood, NY). In this program, images were normalized via their flat field images and exported at their full dynamic range of 16 bit into.tif files. All subsequent analysis was performed in Fiji (v 1.0).53 A brightfield or DAPI image was opened, and a free-form ROI was traced around the outline of the tumor. This was so that any nanodiamond signal could be normalized to the total tumor area and subsequently combined and compared with other subjects. The Cy5 image was then converted to 8 bit and a threshold was applied to decrease autofluorescent contamination. This threshold was kept constant for each image. The thresholded signal area was recorded and normalized to the total tumor area. Averages across groups were taken, and significance was investigated via an ordinary one-way ANOVA in Prism (v 7.0, GraphPad Software, La Jolla, CA). A second analysis was performed on the tumor images: once Cy5 images were thresholded, the particles were counted. Only particles in a circular shape (0.5–1 circularity, ratio of long-short axis) with a size of 5–100 pixels were recorded. These counted pixels were normalized to the tumor’s unit area, and animals within a group were averaged. An ordinary one-way ANOVA was performed for statistical analysis followed by Turkey’s test with a p-value of less than 0.05 considered significant.
In addition, microspectroscopy analysis was performed using a previously described home-built system.38 The system, which allows for simultaneous microscopy and spectroscopy, is designed around an Olympus IX71 inverted fluorescence microscope, with one filter turret modified to accommodate laser input (Optically Pumped Semiconductor Laser, Sapphire, 532 nm, 150 mW adjustable drive, Coherent Inc.) A modular USB spectrometer (HR2000, Ocean Optics) was used for spectra collection, while a CCD color camera allowed for color imaging (AmScope, MT5000-CCD-CK). All filters used were by Semrock unless otherwise indicated. Laser power for analysis was kept to <50 mW throughout, through a 532 nm dichroic mirror (LPD02–532RU) and a 532 nm notch filter (NF01–532U). Imaging via broadband illumination was achieved with 100 mV short arc mercury excitation through the following filter sets (i) blue: FF01–470/28 excitation, BLP01–488R emission, and Q505LP dichroic (Chroma) or (ii) green: FF01–517/20 excitation, BLP02–561R emission, and FF552-Di02 dichroic. Additionally, two-photon imaging was performed with a Zeiss LSM 7MP at the UNC Neuroscience Center Microscopy Core
Supplementary Material
ACKNOWLEDGMENTS
This project has been funded in whole or in part with Federal funds from the National Heart, Lung, and Blood Institute, National Institutes of Health (NHLBI), Department of Health and Human Services, under Contract No. HHSN268201500010C. We would also like to acknowledge Dr. Michelle Itano and the UNC Neuroscience Microscopy Core (funding P30 NS045892 and U54 HD079124) to aid in obtaining two-photon images.
ABBREVIATIONS
- scVEGF
single chain vascular endothelial growth factor
- VEGFR
vascular endothelial growth factor receptor
- FND
fluorescent nanodiamond
- ROI
region of interest
- CDI
carbonyldiimidazole
- PG
poly(glycerol)
- mTz
methyltetrazine
- TCO
trans-Cyclooctene
- SDS-PAGE
Sodium dodecyl sulfate polyacrylamide gel electrophoresis (SDS-PAGE)
- ELISA
enzyme-linked immunosorbent assay
- SLT
Shiga-like-toxin
- ECFC
endothelial colony forming cell
Footnotes
Supporting Information
The Supporting Information is available free of charge on the ACS Publications website at DOI: 10.1021/acs.bioconjchem.8b00803.
Fluorescence spectra, particle size characterization, and additional fluorescence images for visualization of particle accumulation in tumors (PDF)
The authors declare the following competing financial interest(s): M. Torelli and N. Nunn are employees of Adámas; O. Shenderova is an employee and shareholder of Adámas; M. Backer is an employee of Sibtech; and J. Backer is an employee and shareholder of Sibtech. All other authors declare that there is no conflict of interest.
REFERENCES
- (1).Harmsen S, Teraphongphom N, Tweedle MF, Basilion JP, and Rosenthal EL (2017) Optical Surgical Navigation for Precision in Tumor Resections. Mol. Imaging Biol 19 (3), 357–362. [DOI] [PMC free article] [PubMed] [Google Scholar]
- (2).Haque A, Faizi MSH, Rather JA, and Khan MS (2017) Next generation NIR fluorophores for tumor imaging and fluorescence-guided surgery: A review. Bioorg. Med. Chem 25 (7), 2017–2034. [DOI] [PubMed] [Google Scholar]
- (3).Rosenthal EL, Warram JM, De Boer E, Basilion JP, Biel MA, Bogyo M, Bouvet M, Brigman BE, Colson YL, DeMeester SR, et al. (2016) Successful translation of fluorescence navigation during oncologic surgery: a consensus report. J. Nucl. Med 57 (1), 144–150. [DOI] [PMC free article] [PubMed] [Google Scholar]
- (4).Koch M, and Ntziachristos V (2016) Advancing surgical vision with fluorescence imaging. Annu. Rev. Med 67, 153–164. [DOI] [PubMed] [Google Scholar]
- (5).Schubert T, Rausch S, Fahmy O, Gakis G, and Stenzl A (2017) Optical improvements in the diagnosis of bladder cancer: implications for clinical practice. Ther. Adv. Urol 9 (11), 251–260. [DOI] [PMC free article] [PubMed] [Google Scholar]
- (6).Yu S-J, Kang M-W, Chang H-C, Chen K-M, and Yu Y-C (2005) Bright fluorescent nanodiamonds: no photobleaching and low cytotoxicity. J. Am. Chem. Soc 127 (50), 17604–17605. [DOI] [PubMed] [Google Scholar]
- (7).Faklaris O, Garrot D, Joshi V, Druon F, Boudou JP, Sauvage T, Georges P, Curmi PA, and Treussart F (2008) Detection of single photoluminescent diamond nanoparticles in cells and study of the internalization pathway. Small 4 (12), 2236–2239. [DOI] [PubMed] [Google Scholar]
- (8).Vaijayanthimala V, Cheng P-Y, Yeh S-H, Liu K-K, Hsiao C-H, Chao J-I, and Chang H-C (2012) The long-term stability and biocompatibility of fluorescent nanodiamond as an in vivo contrast agent. Biomaterials 33 (31), 7794–7802. [DOI] [PubMed] [Google Scholar]
- (9).Yi J, Manna A, Barr VA, Hong J, Neuman KC, and Samelson LE (2016) madSTORM: a superresolution technique for large-scale multiplexing at single-molecule accuracy. Mol. Biol. Cell 27 (22), 3591–3600. [DOI] [PMC free article] [PubMed] [Google Scholar]
- (10).Schrand AM, Hens SA, and Shenderova OA (2009) Nanodiamond Particles: Properties and Perspectives for Bioapplications. Crit. Rev. Solid State Mater. Sci 34, 18. [Google Scholar]
- (11).Vaijayanthimala V, Lee DK, Kim SV, Yen A, Tsai N, Ho D, Chang H-C, and Shenderova O (2015) Nanodiamond-mediated drug delivery and imaging: challenges and opportunities. Expert Opin. Drug Delivery 12 (5), 735–749. [DOI] [PubMed] [Google Scholar]
- (12).Moore L, Yang J, Lan TTH, Osawa E, Lee D-K, Johnson WD, Xi J, Chow EK-H, and Ho D (2016) Biocompatibility assessment of detonation nanodiamond in non-human primates and rats using histological, hematologic, and urine analysis. ACS Nano 10 (8), 7385–7400. [DOI] [PubMed] [Google Scholar]
- (13).Hsiao WW-W, Hui YY, Tsai P-C, and Chang H-C (2016) Fluorescent nanodiamond: A versatile tool for long-term cell tracking, super-resolution imaging, and nanoscale temperature sensing. Acc. Chem. Res 49 (3), 400–407. [DOI] [PubMed] [Google Scholar]
- (14).Wu Y, Jelezko F, Plenio MB, and Weil T (2016) Diamond quantum devices in biology. Angew. Chem., Int. Ed 55 (23), 6586–6598. [DOI] [PubMed] [Google Scholar]
- (15).Mochalin VN, Shenderova O, Ho D, and Gogotsi Y (2012) The properties and applications of nanodiamonds. Nat. Nanotechnol 7 (1), 11–23. [DOI] [PubMed] [Google Scholar]
- (16).Sarkar SK, Bumb A, Wu X, Sochacki KA, Kellman P, Brechbiel MW, and Neuman KC (2014) Wide-field in vivo background free imaging by selective magnetic modulation of nanodiamond fluorescence. Biomed. Opt. Express 5 (4), 1190–1202. [DOI] [PMC free article] [PubMed] [Google Scholar]
- (17).Igarashi R, Yoshinari Y, Yokota H, Sugi T, Sugihara F, Ikeda K, Sumiya H, Tsuji S, Mori I, Tochio H, et al. (2012) Real-Time Background-Free Selective Imaging of Fluorescent Nanodiamonds in Vivo. Nano Lett. 12 (11), 5726–5732. [DOI] [PubMed] [Google Scholar]
- (18).Hui YY, Su L-J, Chen OY, Chen Y-T, Liu T-M, and Chang H-C (2015) Wide-field imaging and flow cytometric analysis of cancer cells in blood by fluorescent nanodiamond labeling and time gating. Sci. Rep 4, 5574. [DOI] [PMC free article] [PubMed] [Google Scholar]
- (19).Hicklin DJ, and Ellis LM (2005) Role of the Vascular Endothelial Growth Factor Pathway in Tumor Growth and Angiogenesis. J. Clin. Oncol 23 (5), 1011–1027. [DOI] [PubMed] [Google Scholar]
- (20).Takahashi H, and Shibuya M (2005) The vascular endothelial growth factor (VEGF)/VEGF receptor system and its role under physiological and pathological conditions. Clin. Sci 109 (3), 227–241. [DOI] [PubMed] [Google Scholar]
- (21).Koch S, Tugues S, Li X, Gualandi L, and Claesson-Welsh L (2011) Signal transduction by vascular endothelial growth factor receptors. Biochem. J 437 (2), 169–183. [DOI] [PubMed] [Google Scholar]
- (22).Shibuya M (2014) VEGF-VEGFR signals in health and disease. Biomol. Ther 22 (1), 1. [DOI] [PMC free article] [PubMed] [Google Scholar]
- (23).Sia D, Alsinet C, Newell P, and Villanueva A (2014) VEGF signaling in cancer treatment. Curr. Pharm. Des 20 (17), 2834–2842. [DOI] [PubMed] [Google Scholar]
- (24).Sever R, and Brugge JS (2015) Signal transduction in cancer. Cold Spring Harbor Perspect. Med 5 (4), a006098. [DOI] [PMC free article] [PubMed] [Google Scholar]
- (25).Claesson-Welsh L (2016) VEGF receptor signal transduction-A brief update. Vasc. Pharmacol 86, 14–17. [DOI] [PubMed] [Google Scholar]
- (26).Lee Y-J, Karl DL, Maduekwe UN, Rothrock C, Ryeom S, D’Amore PA, and Yoon SS (2010) Differential effects of VEGFR-1 and VEGFR-2 inhibition on tumor metastases based on host organ environment. Cancer Res. 70 (21), 8357–8367. [DOI] [PMC free article] [PubMed] [Google Scholar] [Retracted]
- (27).Giatromanolaki A, Koukourakis MI, Sivridis E, Chlouverakis G, Vourvouhaki E, Turley H, Harris AL, and Gatter KC (2007) Activated Vegfr2/kdr Pathway In Tumour Cells And Tumour Associated Vessels Of Colorectal Cancer. Eur. J. Clin. Invest 37 (11), 878–886. [DOI] [PubMed] [Google Scholar]
- (28).Ellis LM, Takahashi Y, Liu W, and Shaheen RM (2000) Vascular endothelial growth factor in human colon cancer: biology and therapeutic implications. Oncologist 5, 11–15. [DOI] [PubMed] [Google Scholar]
- (29).Bruns CJ, Liu W, Davis DW, Shaheen RM, McConkey DJ, Wilson MR, Bucana CD, Hicklin DJ, and Ellis LM (2000) Vascular endothelial growth factor is an in vivo survival factor for tumor endothelium in a murine model of colorectal carcinoma liver metastases. Cancer 89 (3), 488–499. [PubMed] [Google Scholar]
- (30).Cébe-Suarez S, Zehnder-Fjällman A, and Ballmer-Hofer K (2006) The role of VEGF receptors in angiogenesis; complex partnerships. Cell. Mol. Life Sci 63 (5), 601–615. [DOI] [PMC free article] [PubMed] [Google Scholar]
- (31).Ribatti D, and Crivellato E (2012) Sprouting angiogenesis”, a reappraisal. Dev. Biol 372 (2), 157–165. [DOI] [PubMed] [Google Scholar]
- (32).Yao J, Wu X, Zhuang G, Kasman IM, Vogt T, Phan V, Shibuya M, Ferrara N, and Bais C (2011) Expression of a functional VEGFR-1 in tumor cells is a major determinant of anti-PlGF antibodies efficacy. Proc. Natl. Acad. Sci. U. S. A 108 (28), 11590–11595. [DOI] [PMC free article] [PubMed] [Google Scholar]
- (33).Daenen LGM, Roodhart JML, van Amersfoort M, Dehnad M, Roessingh W, Ulfman LH, Derksen PWB, and Voest EE (2011) Chemotherapy Enhances Metastasis Formation via VEGFR-1-Expressing Endothelial Cells. Cancer Res. 71 (22), 6976–6985. [DOI] [PubMed] [Google Scholar]
- (34).Kaplan RN, Riba RD, Zacharoulis S, Bramley AH, Vincent L, Costa C, MacDonald DD, Jin DK, Shido K, Kerns SA, et al. (2005) VEGFR1-positive haematopoietic bone marrow progenitors initiate the pre-metastatic niche. Nature 438 (7069), 820–827. [DOI] [PMC free article] [PubMed] [Google Scholar]
- (35).Golestani R, Jung J-J, and Sadeghi MM (2016) Molecular imaging of angiogenesis and vascular remodeling in cardiovascular pathology. J. Clin. Med 5 (6), 57. [DOI] [PMC free article] [PubMed] [Google Scholar]
- (36).Boudou J-P, David M-O, Joshi V, Eidi H, and Curmi PA (2013) Hyperbranched polyglycerol modified fluorescent nanodiamond for biomedical research. Diamond Relat. Mater 38, 131–138. [Google Scholar]
- (37).Sotoma S, Igarashi R, Iimura J, Kumiya Y, Tochio H, Harada Y, and Shirakawa M (2015) Suppression of nonspecific protein-nanodiamond adsorption enabling specific targeting of nanodiamonds to biomolecules of interest. Chem. Lett 44 (3), 354–356. [Google Scholar]
- (38).Shenderova O, Nunn N, Oeckinghaus T, Torelli MD, McGuire G, Smith K, Danilov E, Reuter R, Wrachtrup J, Shames A, et al. (2017) Commercial quantities of ultrasmall fluorescent nanodiamonds containing color centers. Proc. SPIE, 1011803. [Google Scholar]
- (39).Hermanson GT (2013) Bioconjugate Techniques, Academic Press. [Google Scholar]
- (40).Backer MV, Levashova Z, Patel V, Jehning BT, Claffey K, Blankenberg FG, and Backer JM (2007) Molecular imaging of VEGF receptors in angiogenic vasculature with single-chain VEGF-based probes. Nat. Med 13 (4), 504. [DOI] [PubMed] [Google Scholar]
- (41).Backer MV, and Backer JM (2001) Functionally active VEGF fusion proteins. Protein Expression Purif. 23 (1), 1–7. [DOI] [PubMed] [Google Scholar]
- (42).Imoukhuede P, and Popel AS (2011) Quantification and cell-to-cell variation of vascular endothelial growth factor receptors. Exp. Cell Res 317 (7), 955–965. [DOI] [PMC free article] [PubMed] [Google Scholar]
- (43).Chen JH, Wang XC, Kan M, and Sato JD (2001) Effect of FGF 1 and FGF 2 on VEGF binding to human umbilical vein endothelial cells. Cell biology international 25 (3), 257–260. [DOI] [PubMed] [Google Scholar]
- (44).Jin X, Ge X, Zhu D. l., Yan C, Chu Y-F, Chen W. d., Liu J, and Gao P. j. (2007) Expression and function of vascular endothelial growth factor receptors (Flt-1 and Flk-1) in vascular adventitial fibroblasts. J. Mol. Cell. Cardiol 43 (3), 292–300. [DOI] [PubMed] [Google Scholar]
- (45).Levashova Z, Backer M, Hamby CV, Pizzonia J, Backer JM, and Blankenberg FG (2010) Molecular imaging of changes in the prevalence of vascular endothelial growth factor receptor in sunitinib-treated murine mammary tumors. J. Nucl. Med 51 (6), 959. [DOI] [PubMed] [Google Scholar]
- (46).Blanco E, Shen H, and Ferrari M (2015) Principles of nanoparticle design for overcoming biological barriers to drug delivery. Nat. Biotechnol 33 (9), 941–951. [DOI] [PMC free article] [PubMed] [Google Scholar]
- (47).Robinson ME, Ng JD, Zhang H, Buchman JT, Shenderova OA, Haynes CL, Ma Z, Goldsmith RH, and Hamers RJ (2018) Optically detected magnetic resonance for selective imaging of diamond nanoparticles. Anal. Chem 90, 769. [DOI] [PMC free article] [PubMed] [Google Scholar]
- (48).Shames AI, Smirnov AI, Milikisiyants S, Danilov EO, Nunn N, McGuire G, Torelli MD, and Shenderova O (2017) Fluence-Dependent Evolution of Paramagnetic Triplet Centers in e-Beam Irradiated Microcrystalline Ib Type HPHT Diamond. J. Phys. Chem. C 121 (40), 22335–22346. [Google Scholar]
- (49).Shenderova O, Panich AM, Moseenkov S, Hens SC, Kuznetsov VL, and Vieth HM (2011) Hydroxylated Detonation Nanodiamond: FTIR, XPS, and NMR studies. J. Phys. Chem. C 115, 19005–19011. [Google Scholar]
- (50).Backer MV, Patel V, Jehning BT, Claffey KP, and Backer JM (2006) Surface immobilization of active vascular endothelial growth factor via a cysteine-containing tag. Biomaterials 27 (31), 5452–5458. [DOI] [PubMed] [Google Scholar]
- (51).Backer MV, and Backer JM (2001) Targeting Endothelial Cells Overexpressing VEGFR-2: Selective Toxicity of Shiga-like Toxin- VEGF Fusion Proteins. Bioconjugate Chem. 12 (6), 1066–1073. [DOI] [PubMed] [Google Scholar]
- (52).Ludlow JW, Kinev A, VanKanegan M, Buehrer B, Trotta N, and Basu J (2016) Toxicological Risk Assessment-Proposed Assay Platform Using Stem and Progenitor Cell Differentiation in Response to Environmental Toxicants In Human Stem Cell Toxicology (Sherley JL, Ed.), pp 94–123, Royal Society of Chemistry. [Google Scholar]
- (53).Schindelin J, Arganda-Carreras I, Frise E, Kaynig V, Longair M, Pietzsch T, Preibisch S, Rueden C, Saalfeld S, Schmid B, et al. (2012) Fiji: an open-source platform for biological-image analysis. Nat. Methods 9 (7), 676. [DOI] [PMC free article] [PubMed] [Google Scholar]
Associated Data
This section collects any data citations, data availability statements, or supplementary materials included in this article.