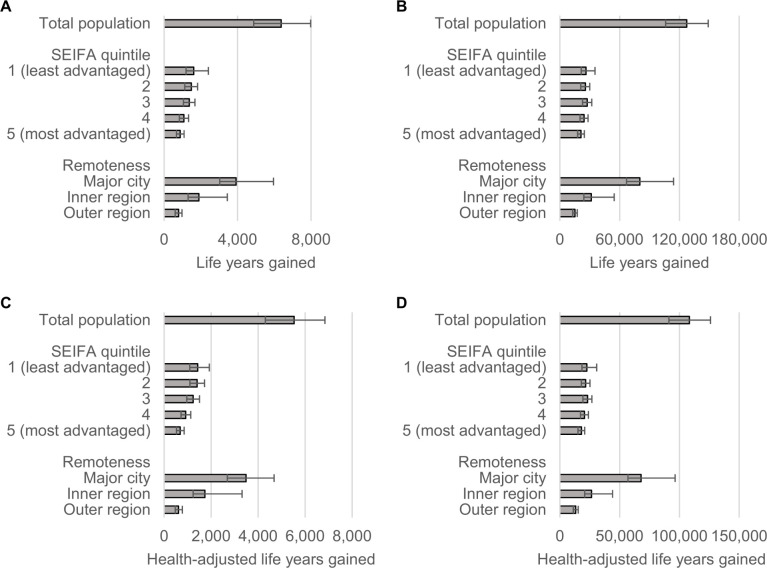
Fig 2. Total (A–B) and HALYs (C–D) gained during the first 10 years (A, C) and over the population lifetime (B, D).
Estimates are presented separately for the total population and selected subgroups. Error bars represent 95% uncertainty intervals. HALYs, health-adjusted life years; SEIFA, Socio-Economic Indexes for Areas.

