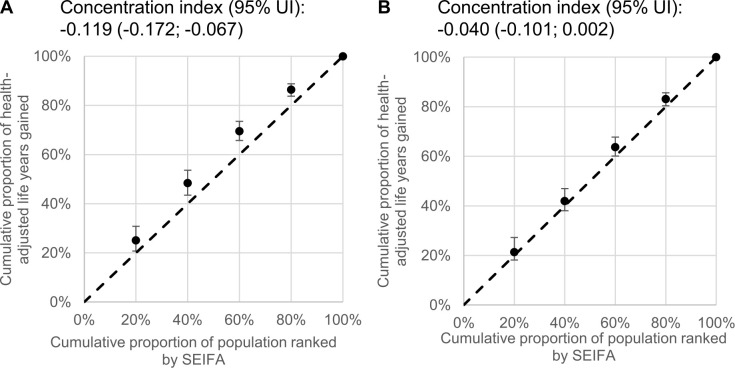
Fig 4.
Relative inequality based on socioeconomic status in HALYs gained estimated over 10 years (A) and population lifetime (B). Values above the dotted unity lines represent greater benefits among disadvantaged groups (i.e., lowest SEIFA ranking). Dots and error bars indicate median and 2.5–97.5 percentiles of n = 2,000 estimates. The concentration index quantifies the distribution of HALY over socioeconomic quantiles and takes a negative value when HALYs gained are disproportionally concentrated in the most disadvantaged groups. HALY, health-adjusted life years; SEIFA, Socio-Economic Indexes for Areas; UI, uncertainty interval.

