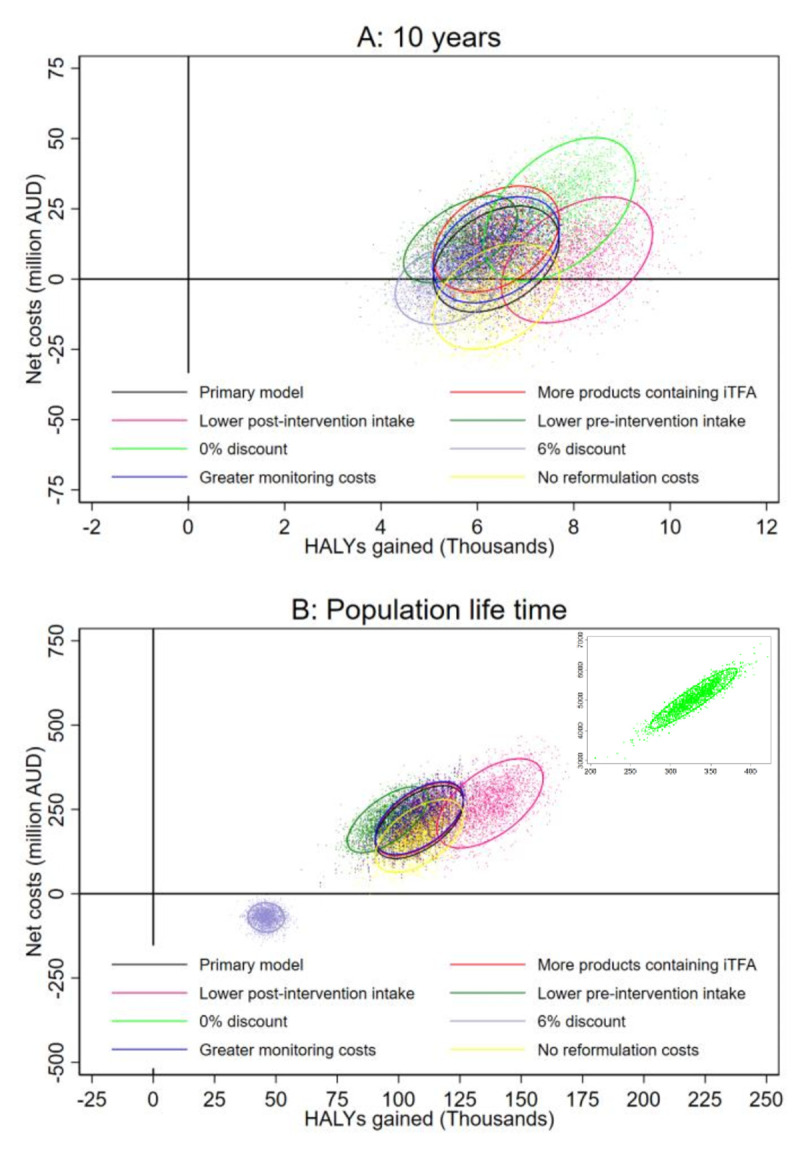
Fig 5. Net costs and HALYs gained during the first 10 years (A) and over the population lifetime (B) estimated in the primary model and in deterministic sensitivity analyses.

See Methods for descriptions of sensitivity analyses. Dots represent estimates of n = 2,000 simulations, and ellipses indicate 95% confidence intervals centred around their means. AUD, Australian dollar; HALY, health-adjusted life years; iTFA, industrial TFA.
