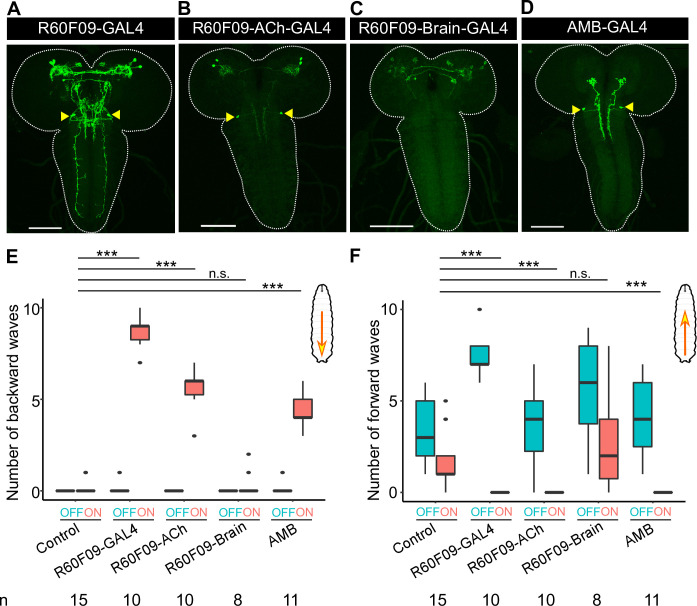
Fig 1. AMBs are a pair of neurons in SEZ that can induce backward locomotion upon activation.
(A-D) Expression patterns of GAL4 lines. The yellow arrowheads indicate the somas of AMBs. Scale bar, 100 μm. Genotypes of each GAL line are shown in S1 Table. (E, F) The number of backward/forward waves in 10 seconds before (OFF) or during (ON) optogenetic activation with CsChrimson. Genotypes: w; UAS-CsChrimson/+; +/+ (Control); other four lines drive CsChrimson by GAL4 lines shown in (A-D). Control, n = 15; R60F09-GAL4, n = 10; R60F09-ACh-GAL4, n = 10; R60F09-Brain-GAL4, n = 8; AMB-GAL4, n = 19. In the boxplot, the width of the box represents the interquartile range and the dot represent outlier in the graph. The whiskers extend to the data point which is less than 1.5 times the length of the box away from the box, and the dot represent outlier. We assessed statistical significance using the Wilcoxon rank sum test and corrected for multiple comparisons using the Holm method. ***p<0.001.

