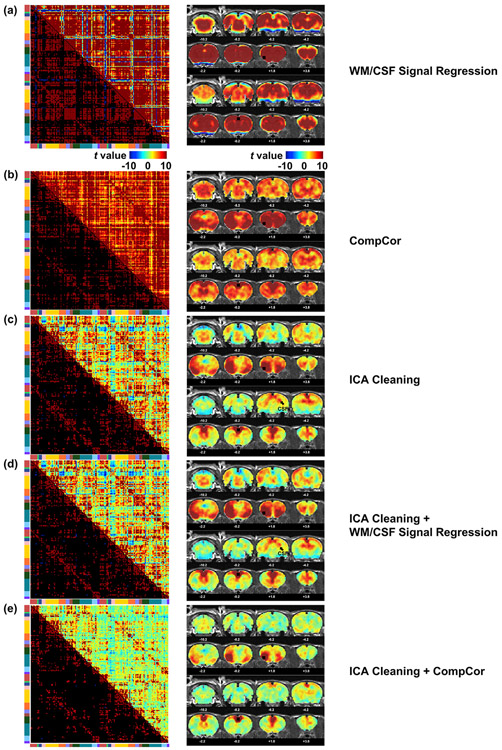
Fig. 8.
Comparison among different nuisance regression methods. For each subfigure, the left column shows the FC matrix with the same ROI definition as in Fig. 4; The right column shows two seedmaps of the insula (upper) and ACA (lower). (a) WM/CSF signal regression. (b) CompCor. (c) ICA cleaning. (d) ICA cleaning with WM/CSF signal regression. (e) ICA cleaning with CompCor.

