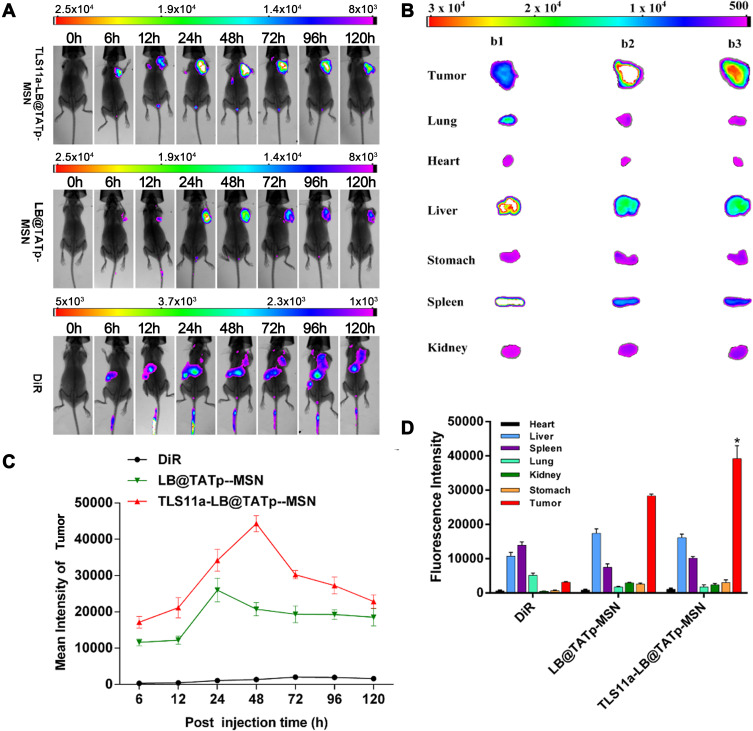
Figure 7.
Specific distribution of intravenously injected TLS11a-LB@TATp-MSN and LB@TATp-MSN to H22 tumors in the right axilla of BALB/c mice. DiR-labeled TLS11a-LB@TATp-MSN, LB@TATp-MSN, and DiR were intravenously injected via the tail vein into BALB/c mice carrying H22 tumors in the right axilla. (A) Fluorescence in the mice was examined using an in vivo imaging system for small animals. (B) The fluorescence in the heart, liver, spleen, lung, kidney, stomach, and tumor tissues of the DiR-labeled (b1) TLS11a-LB@TATp-MSN, (b2) LB@TATp-MSN, and (b3) DiR mice. (C) The fluorescence intensities of tumor tissues. Bruker MI SE software was used for quantification. (D) The fluorescence intensities of tissues of the TLS11a-LB@TATp-MSN, LB@TATp-MSN, and DiR mice after 48-h treatment. *P < 0.05 compared with the LB@TATp-MSN group.

