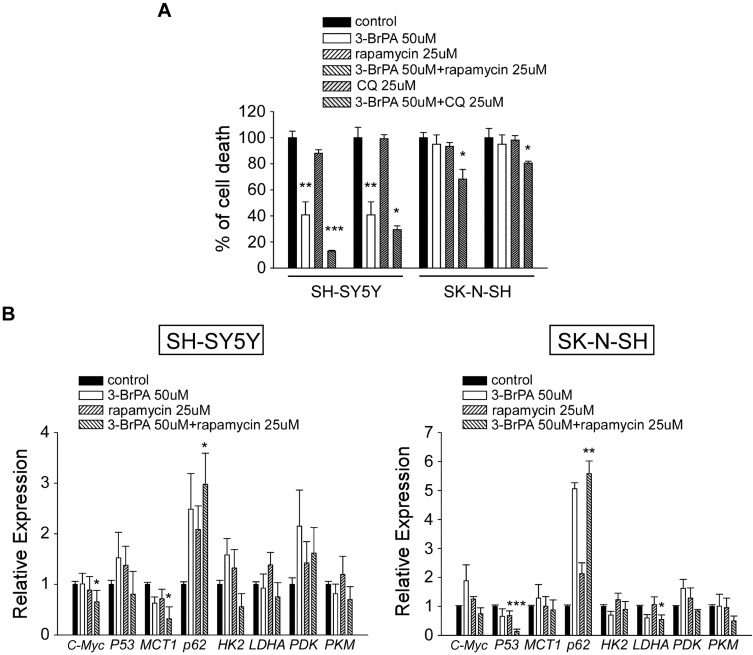
Figure 3.
Effect of 3-BrPA and rapamycin in NB cells by CCK-8 analysis and QPCR analysis. (A) The cell proliferation effect of 3-BrPA, rapamycin, 3-BrPA + rapamycin, CQ, 3-BrPA + CQ treatment in SH-SY5Y and SK-N-SH by CCK-8 analysis. (B) Gene expression level in SH-SY5Y and SK-N-SH treated with control, 3-BrPA, rapamycin, 3-BrPA + rapamycin by QPCR analysis (*P<0.05; **P<0.01; ***P<0.001).

