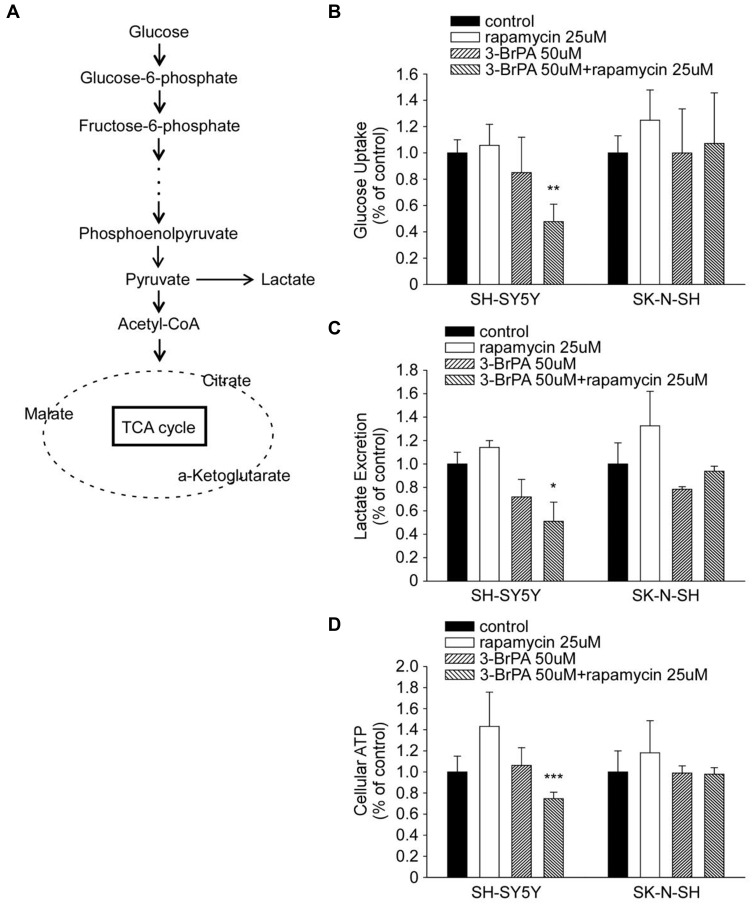
Figure 7.
3-BrPA and rapamycin administration induced metabolic changes in NB cells. (A) Diagram depicting glucose metabolism via aerobic glycolysis and tricarboxylic acid (TCA) cycle. (B–D) Relative changes in the cellular glucose uptake, lactate production and intracellular ATP content in SH-SY5Y and SK-N-SH cells upon 3-BrPA, rapamycin or 3-BrPA + rapamycin treatment. Data shown are averages of triplicate. *P<0.05; **P<0.01; ***P<0.001.

