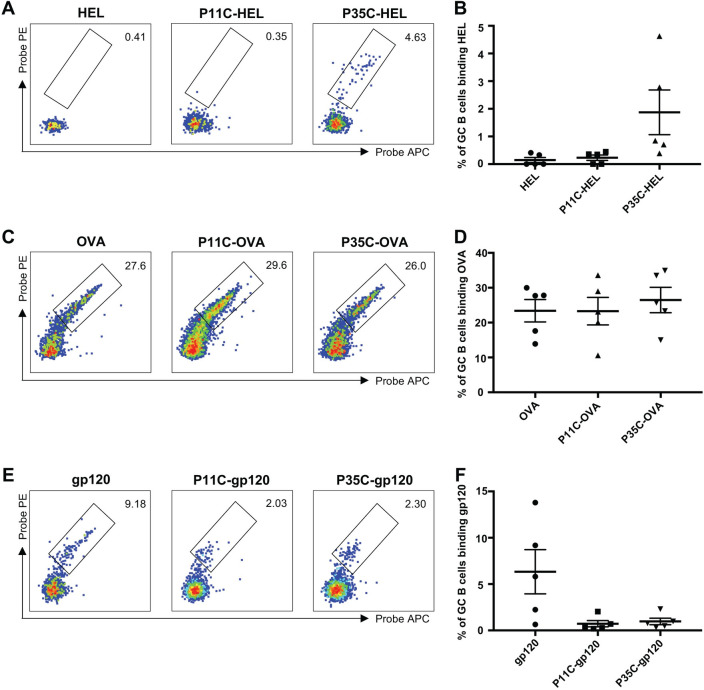
Fig 5. HEL/OVA/gp120-specific B cell responses in immunized mice.
(A—B) Representative flow cytometric plots (A) and frequency (B) of GC B cells (B220+IgD–CD38loGL7+) from mice (n = 5) immunized with adjuvanted (Addavax) immunogens double stained with HEL probes. (C—D) Representative flow cytometric plots (C) and frequency (D) of GC B cells (B220+IgD–CD38loGL7+) from mice (n = 5) immunized with adjuvanted (Addavax) immunogens double stained with OVA probes. (E—F) Representative flow cytometric plots (E) and frequency (F) of GC B cells (B220+IgD–CD38loGL7+) from mice (n = 5) immunized with adjuvanted (Addavax) immunogens double stained with gp120 probes. Data indicate the mean ± SEM.

