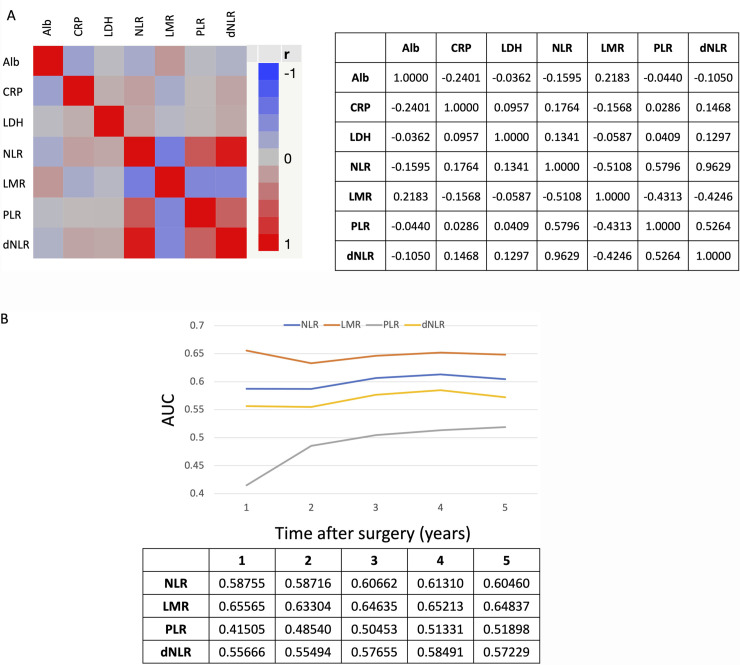
Fig 1. Analyses of correlation between inflammatory marker metrics and their prognostic ability for OS over time.
(A) Pearson product-moment correlation coefficients (r) between inflammatory markers in tabular and graphic representation. (B) The transition in AUC of ROC curve analyses of inflammatory markers for OS according to time after surgery. The table shows AUC data for each inflammatory metric and year after surgery. Alb, albumin; CRP, C-reactive protein; dNLR, derived neutrophil-lymphocyte ratio; LDH, lactate dehydrogenase; LMR, lymphocyte-monocyte ratio; NLR, neutrophil-lymphocyte ratio; PLR, platelet-lymphocyte ratio.

