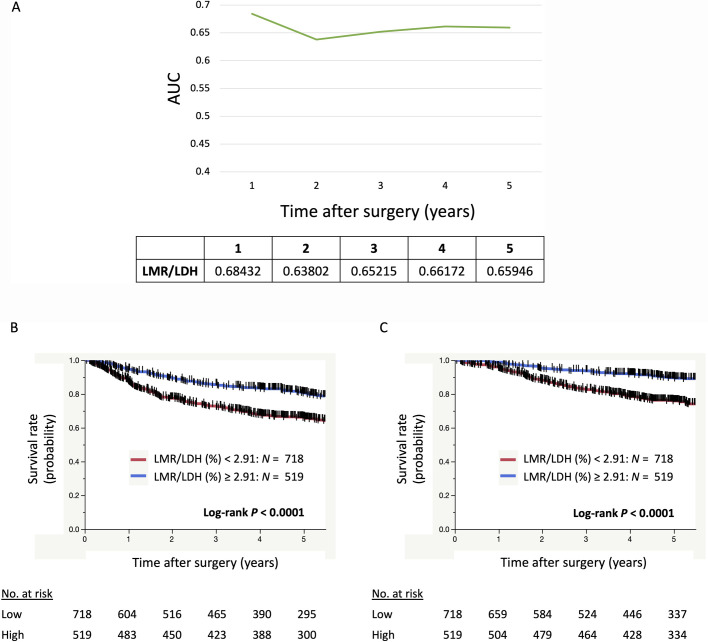
Fig 3. The LMR:LDH ratio as a prognostic indicator in NSCLC.
(A) The transition in the AUC of ROC curve analyses for OS over time after surgery for LMR/LDH. (B) Kaplan–Meier curves showing survival of the patients according to LMR/LDH for DFS and for OS (C). LDH, lactate dehydrogenase; LMR, lymphocyte-monocyte ratio.

