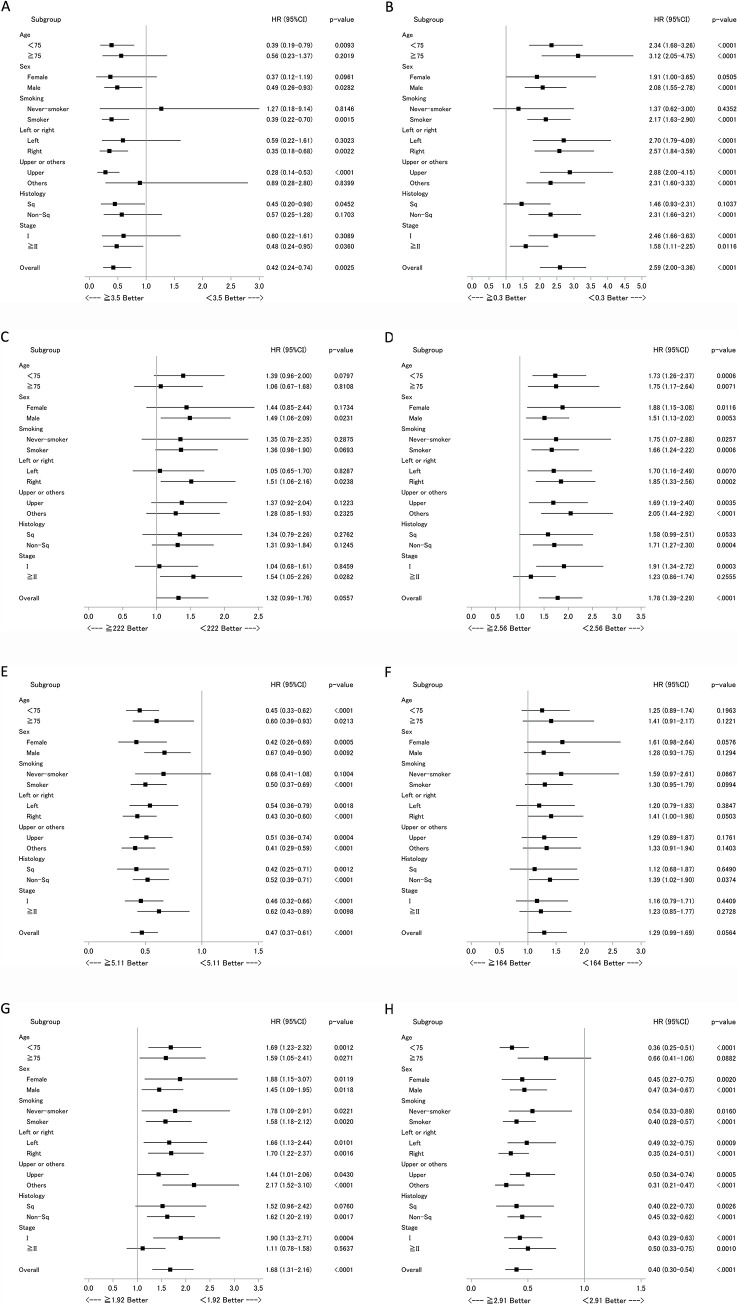
Fig 5. Subset analyses of the relationship between OS and inflammatory markers, according to clinical factors.
Data are presented as forest plots, with hazard ratios (HR), associated confidence intervals (CI) and p-values for each group. Data for each inflammatory marker appears in a separate panel, as follows (with cut-off level); (A) Alb (g/dL); ≥ 3.5/< 3.5, (B) CRP (mg/dL); ≥ 0.3/< 0.3, (C) LDH (U/L); ≥ 222/< 222, (D) NLR; ≥ 2.56/< 2.56, (E) LMR; ≥ 5.11/< 5.11, (F) PLR; ≥ 164/< 164, (G) dNLR; ≥ 1.92/< 1.92, and (H) LMR/LDH (%); ≥ 2.91/< 2.91. Alb, albumin; CRP, C-reactive protein; dNLR, derived neutrophil-lymphocyte ratio; LDH, lactate dehydrogenase; LMR, lymphocyte-monocyte ratio; NLR, neutrophil-lymphocyte ratio; PLR, platelet-lymphocyte ratio.

