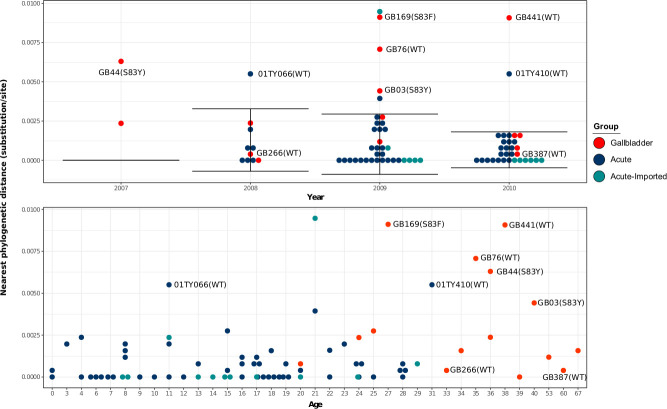
Fig 2. The Distribution of nearest phylogenetic distances of gallbladder and acute H58 isolates over the study period.
Each circle represents the phylogenetic distance from each isolate to its nearest neighbour on the phylogenetic tree. The error bar represents the average phylogenetic distance to the nearest neighbour (± standard deviation) for acute H58 isolates. Gallbladder and acute isolates estimated to have originated from chronic carriers are labelled with their corresponding strain names.

