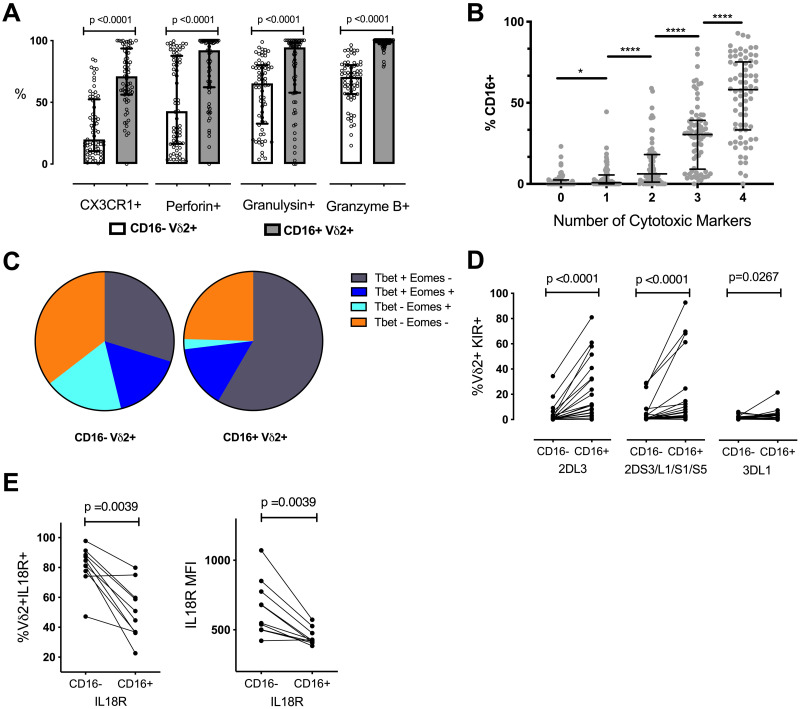
Fig 1. CD16+ Vδ2 T cells are more likely to express cytotoxic markers and KIRs.
(A) The percentage of CD16+ and CD16-Vδ2 T cells expressing relevant cytotoxic markers are shown (n = 65; scatter plot with median and IQR). (B) Vδ2 T cells positive for 4 or any combination of 3, 2 or 1 of the cytotoxicity markers listed in A are grouped along the x-axis and their relative percentage of CD16 is shown (n = 65; scatter plot with median and IQR). (C) The percentage of CD16+ and CD16-Vδ2s expressing the listed combinations of the transcription factors Tbet and Eomes are shown. (n = 65). (D) The percentage of CD16+ and CD16-Vδ2 T cells expressing the listed KIR or KIR combinations is shown. Individuals who were genotype negative for the listed KIRs were omitted from this analysis (n = 22 for KIR3DL1 and KIR2DS3/L1/S1/S5; n = 20 for KIR2DL3). (E) The percentage of CD16+ and CD16-Vδ2 T cells expressing IL18Rα and the MFI of IL18Rα on CD16+ and CD16-Vδ2 T cells is shown (n = 10). All Vδ2+ T cells shown were gated on singlets and CD3+ events to exclude NK cells. P values for A, B, D and E determined by Wilcoxon matched pairs signed rank test.

