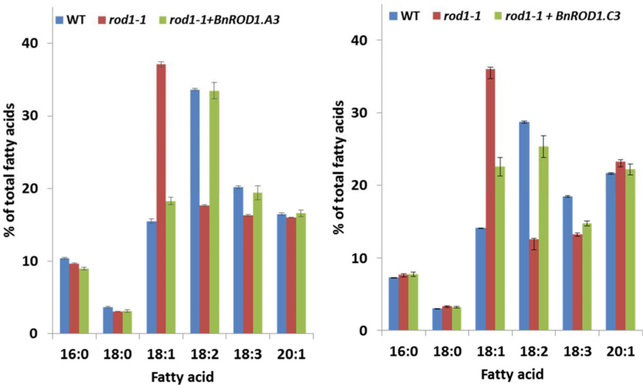
Figure 3. BnROD1.A3 and BnROD1.C3 complement an Arabidopsis rod1 mutant.
Data are seed fatty acid compositions from plants of wild type (WT), the rod1–1 mutant and rod1–1 expressing either a BnROD1.A3 (a) or BnROD1.C3 (b) transgene. Means ± SE (n = 9). Statistical principal component analysis indicates that the WT and each complemented line are highly similar and very different from the rod1–1 mutant.

