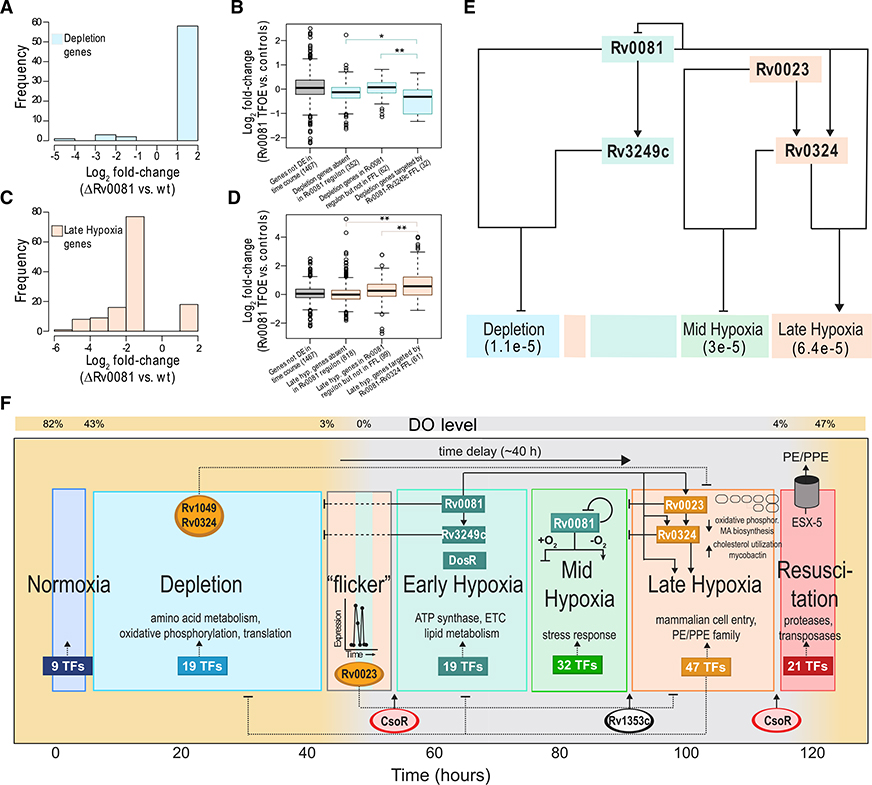
Figure 4. Data Supporting Rv0081-Controlled Interlocking FFLs and Overview of the Transcriptional Dynamics across the Six-State Model.
(A) The log2 fold change (FC) distribution of depletion genes with significant differential expression (adjusted p < 0.05, absolute log2 FC > 1) from ΔRv0081 strain in hypoxia.
(B) Boxplots representing log2 FC of various gene groups related to depletion state from Rv0081 overexpression. The number in parentheses indicates the number of genes evaluated in each group. Horizontal black lines in each box indicate median values. Boxes cover the 25th-75th percentile ranges.
(C) The log2 FC distribution of late hypoxia genes with significant differential expression (adjusted p < 0.05, absolute log2 FC > 1) from ΔRv0081 strain in hypoxia.
(D) Boxplots representing log2 FC of various gene groups related to late hypoxia state from Rv0081 overexpression. Horizontal black lines in each box indicate median values. Boxes cover the 25th-75th percentile ranges.
(E) Model of Rv0081-controlled interlocking FFLs that together upregulate a significant number of genes corresponding to late hypoxia, while also repressing mid hypoxia and depletion genes. The p values for enrichment of the FFL-controlled genes from each state are indicated below the state name, as evaluated using a hypergeometric test.
(F) Summary overview of the transcriptional dynamics, inferred key regulators, and regulatory circuits that were revealed from the high-resolution and longitudinal gene expression profiling across the O2 gradient.
See also Figures S2–S4. *p < 0.05 and **p < 0.01.

