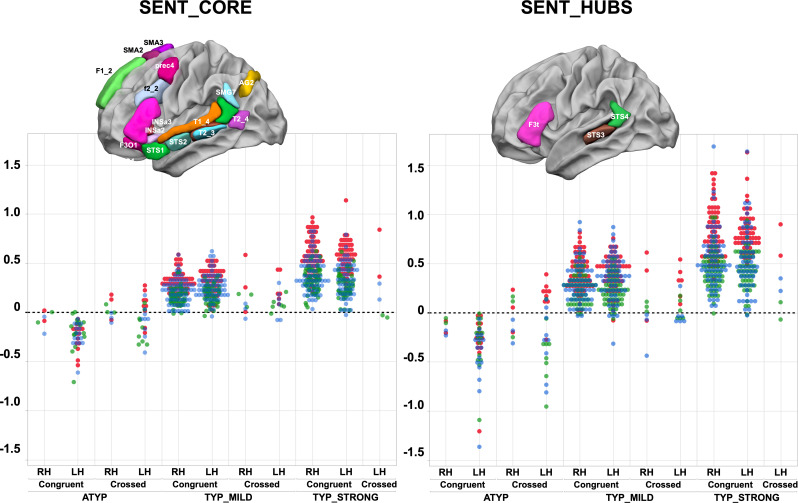
Figure 1. Scatterplots of individual asymmetry values in each task measured as the mean of SENT_CORE and as the mean of the three hubs (SENT_HUBS) for the three groups clustered by hierarchical clustering and stratified according to their status as CONGRUENT or CROSSED and their handedness (right-handers: RH, left-handers: LH) .
The first row depicts the location of the 18 hROIs constituting the SENT_CORE network (left) and the 3 hROIs constituting SENT_HUBS (right). Atypicals (ATYP), typicals with moderate asymmetries (TYP_MILD) and typicals with strong asymmetries (TYP_STRONG) correspond to the three groups resulting from multitask and multimodal hierarchical agglomerative clustering. (PRODSENT-WORD: red, LISNSENT-WORD: green and READSENT-WORD: blue).

