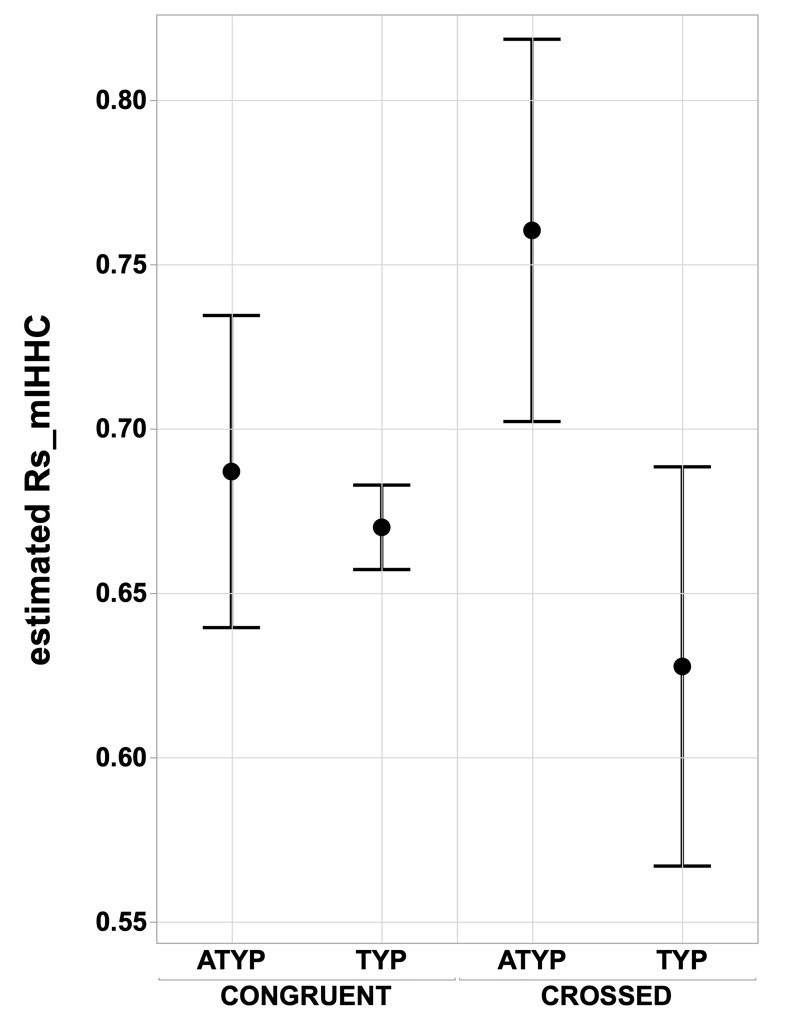
Figure 4. Interhemispheric intrinsic connectivity strength across homotopic regions (Rs_mIHHC) in SENT_CORE in the CONGRUENT and CROSSED TYP and ATYP groups.
The estimated mean interhemispheric homotopic correlation expressed as the Fisher z-transformation of Rs_mIHHC is higher in the CROSSED atypicals group (N = 12) than in the TYP group (merging TYP_MILD and TYP_STRONG, N CROSSED = 11, N CONGRUENT = 246), regarding of whether they are CONGRUENT or CROSSED (both p<0.016, Tukey’s HSD test).

