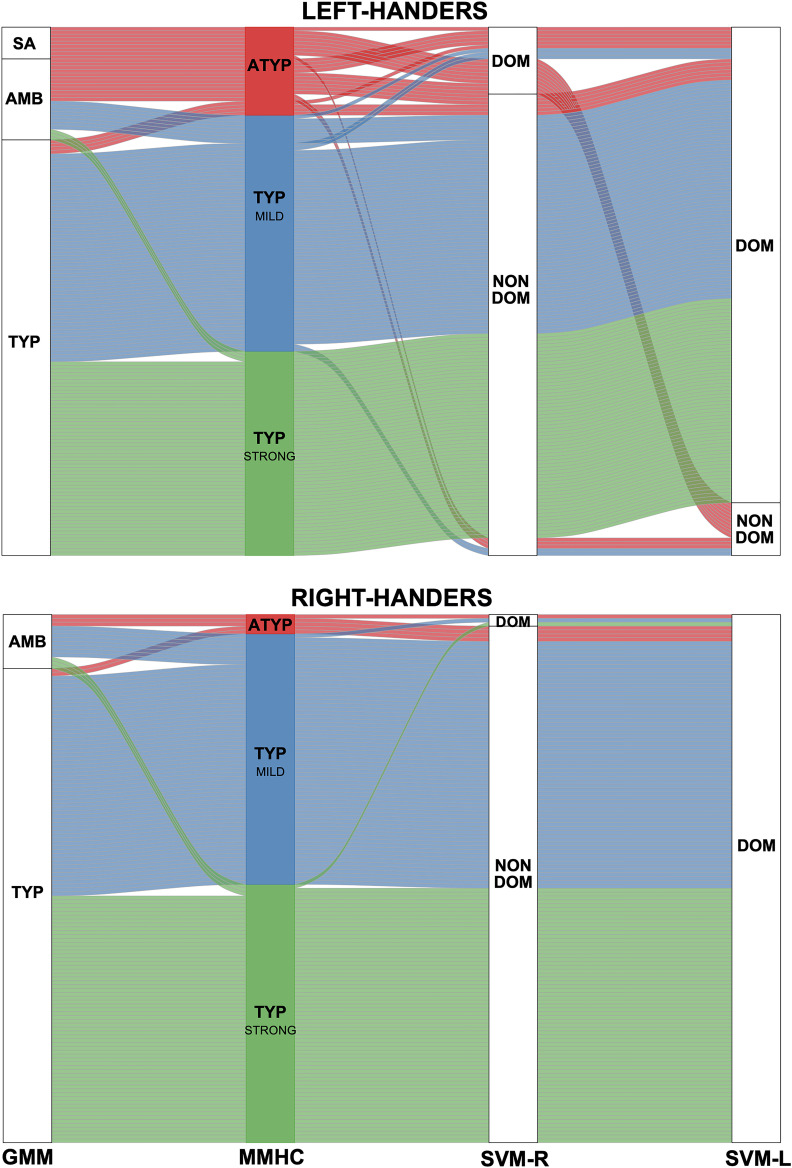
Figure 6. Alluvial plots comparing the present Multitask Multimodal Hierarchical Classification (MMHC) with two previous classifications only based on the functional asymmetry during production of sentences minus word-list in the same sample of participants: Gaussian Mixture Modeling (GMM) classification on Hemispheric Functional Lateralization Index (HFLI, Mazoyer et al., 2014) and Support Vector Machine (Zago et al., 2017) classification in the right (SVM-R) and left hemisphere (SVM-L).
Each line corresponds to a participant with the following color code: red for multitask multimodal hierarchical classification-atypical (ATYP), blue for multitask multimodal hierarchical classification-TYP_MILD, and green for multitask multimodal hierarchical classification-TYP_STRONG. The Gaussian mixture modeling method identified each individual as either strong_atypical (SA), ambilateral (AMB), or typical (TYP). identified the voxel-based pattern of each hemisphere of an individual as either dominant (DOM) or nondominant (NON DOM).

