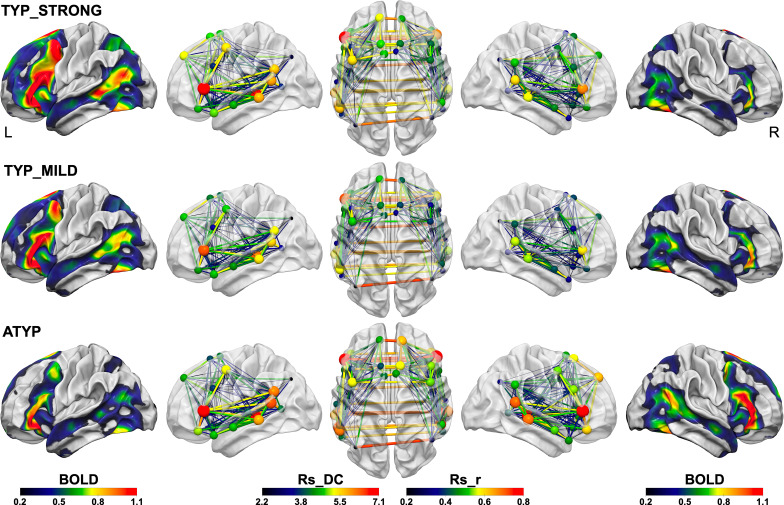
Figure 7. Summary figure illustrating the different SENT_CORE intra- and inter-hemispheric organizations observed in the three groups identified by hierarchical clustering.
The left column shows the group mean activation maps during PRODSENT-WORD (BOLD activation amplitude is given by color scale) of the left hemisphere and the right column the mean activation map of the right hemisphere superimposed on the white matter surface rendering of the BIL and GIN template obtained with the Surf Ice software (https://www.nitrc.org/projects/surfice/). The second, third and fourth columns show the left lateral, superior and right lateral views of the SENT_CORE intrinsic connectivity network, each region of the network being represented by a sphere located at the mass center of its MNI coordinates. For each SENT_CORE region, a colored sphere indicate the group average region degree centrality of intrinsic connectivity (the Rs_DC value is given by color scale, and sphere size is proportional to value), whereas a colored line indicates the strength of the Pearson intrinsic correlation coefficient between two SENT_CORE regions (the Rs_r value is given by color scale, and line thickness is proportional to value).

