. 2020 Nov 2;9:e56059. doi: 10.7554/eLife.56059

Figure 8. Effects of Rab11a inhibition or knockdown on corin and CD320 expression in MDCK cells.

(A) Corin (green) and Rab11 proteins (red), including Rab11a, Rab11b, and dominant-negative (DN) mutants that were inhibitory to Rab11a and Rab11b, respectively, were co-expressed in MDCK cells. Immunostaining and confocal microscopy were used to analyze corin expression on apical and basolateral membranes, as indicated in X-Y and X-Z views. Each image represents the data from four experiments. Scale bars: 5 μm. (B) qRT-PCR analysis of Rab11a mRNA levels in MDCK cells transfected with two sets of shRNAs targeting the RAB11A gene (shRab11a1 and shRab11a2) or non-targeting control shRNAs (shNC). The data are mean ± SD from five experiments, analyzed by ANOVA. (C) Immunostaining of corin and CD320 in MDCK cells transfected with RAB11A-targeting shRNAs (shRab11a1 and shRab11b) or non-targeting shRNAs (shNC). X-Y and X-Z views are indicated. (D) A proposed model. Corin and CD320 (red dots) are transported from Golgi, likely via central recycling endosomes (CRE), to a Rab11a-positive sorting station, where the DSSDE motif is recognized for apical sorting via apical recycling endosomes (ARE) (left panel). Any pool of corin and CD320 that is endocytosed may also be re-sorted apically via Rab11a-positive endosomes. Mutations altering the DSSDE motif abolish such a mechanism, resulting in apical and basolateral expression of corin and CD320 mutants (right panel).

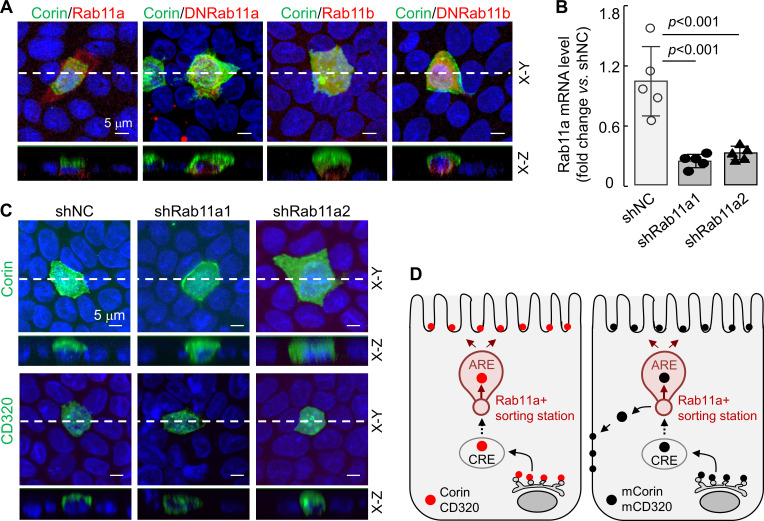
Figure 8—source data 1. Source data for Figure 8B.

Figure 8.

Figure 8—figure supplement 1. Effects of Rab11a inhibition on apical corin and CD320 expression.

Figure 8—figure supplement 1.

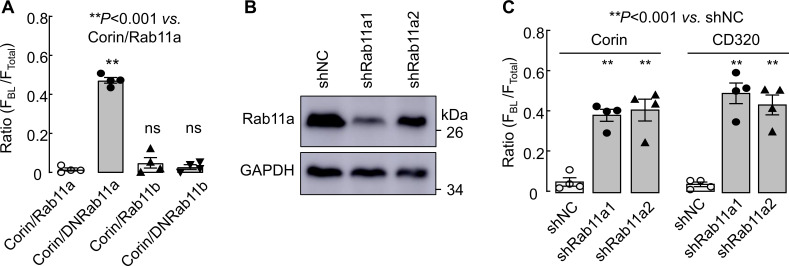
(A) Corin WT co-expressed with Rab11a, Rab11b, or dominant-negative (DN) Rab11a or Rab11b mutants in MDCK cells was analyzed by immunostaining and confocal microscopy. Quantitative data of the ratio of FBL/FTotal from four experiments are shown. (B) Western blotting of Rab11a protein in MDCK cells transfected with non-targeting (shNC) and two sets of RAB11A-targeting (shRab11a1 and shRab11a2) shRNAs. GAPDH was used as a control. (C) Quantitative data of the ratio of FBL/FTotal for corin and CD320 expression on apical and basolateral membranes in shRNA-transfected MDCK cells from four experiments. Statistical analysis was done with ANOVA. n.s., not significant vs. respective controls in each experiment.
Figure 8—figure supplement 1—source data 1. Source data for Figure 8—figure supplement 1A.
Figure 8—figure supplement 1—source data 2. Source data for Figure 8—figure supplement 1C.
Figure 8—figure supplement 2. Effects of Rab11b knockdown on corin and CD320 expression in MDCK cells.

Figure 8—figure supplement 2.

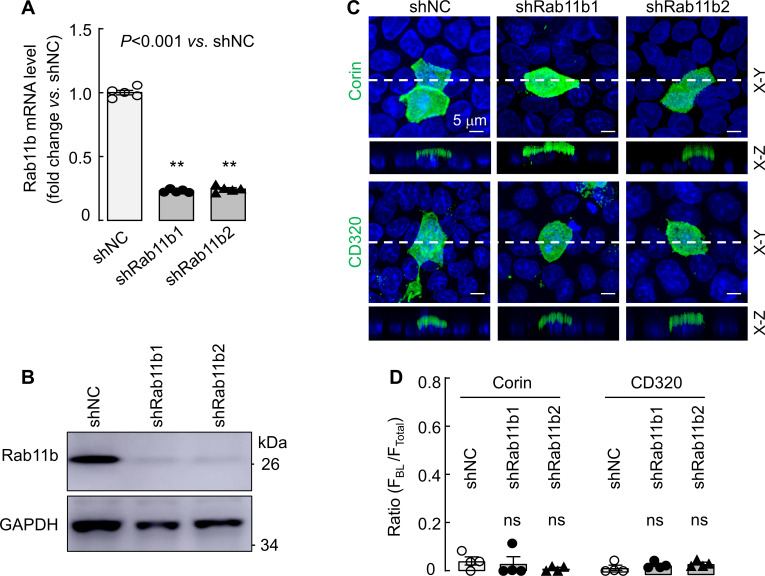
MDCK cells were transfected with non-targeting (shNC) or two sets of RAB11B-targeting (shRab11b1 and shRab11b2) shRNAs. Quantitative RT-PCR (A) and western blotting (B) were used to examine Rab11b mRNA and protein expression, respectively, in the shRNA-transfected MDCK cells. (C) Apical corin (top panels) and CD320 (lower panels) expression in the shRNA-transfected MDCK cells was examined by immunostaining and confocal microscopy with X-Y and X-Z views indicated. (D) Quantitative data of the ratio of FBL/FTotal for corin and CD320 expression on apical and basolateral membranes in shRNA-transfected MDCK cells from four experiments. Statistical analysis was done with ANOVA. n.s., not significant vs. respective controls in each experiment. Key Resources Table. Information on genes, cell lines, plasmids and antibodies.
Figure 8—figure supplement 2—source data 1. Source data for Figure 8—figure supplement 2A.
Figure 8—figure supplement 2—source data 2. Source data for Figure 8—figure supplement 2D.