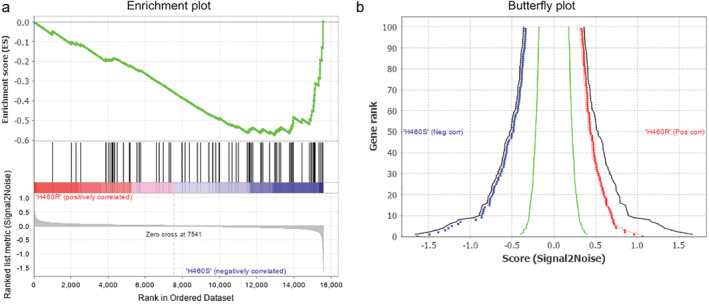
Figure 1.

Bioinformatic analysis of H460R and H460S. (a) The GSEA results show the correlation of stem related gene sets ( ) Enrichment profile, (
 ) Hits, (
 ) Ranking metric scores. (b) Shows the relationship between the first (the right curve) and the last 100 (the left curve) genes and the signal‐to‐noise ratio (
 ) Observed pos, (
 ) Observed neg, (
 ) Permuted pos 1%, (
 ) Permuted neg 1%, (
 ) Permuted pos 5%, (
 ) Permuted neg 1%, (
 ) Permuted pos 50%, (
 ) Permuted neg 50%.
