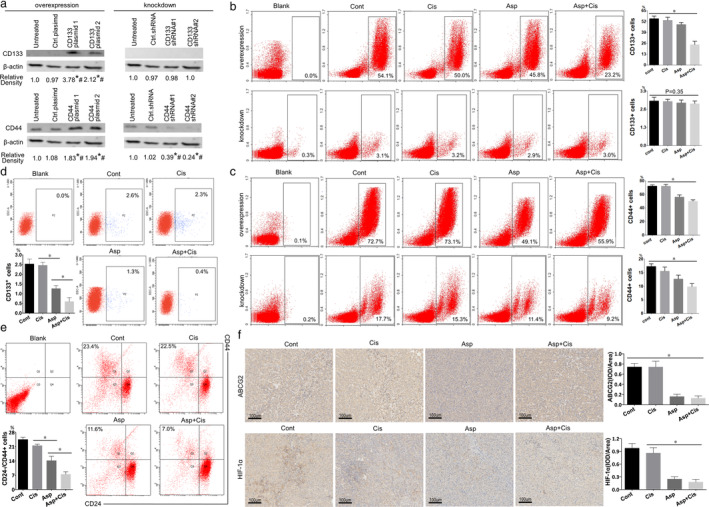
Figure 4.

(a) Flow cytometry showed that CD133 positive cell amount was higher in the Cont and Cis groups, and *P < 0.05 compared with the Asp and Asp + Cis groups. Values are expressed as means ± SD, n = 3. (b) Flow cytometry showed that CD24‐/CD44+ cells amount was lowest in the Asp + Cis group and *P < 0.05 compared with Asp, Cis, and Cont groups. Values are expressed as means ± SD, n = 3. (c) ABCG2 and HIF‐1α expression in H460R transplantation tumors with aspirin (Asp) or cisplatin (Cis) treatment for 21 days. The positive rate was highest in the Asp + Cis group. *P < 0.05 compared with the Cont and Cis groups. Values are expressed as means ± SD, n = 3.
