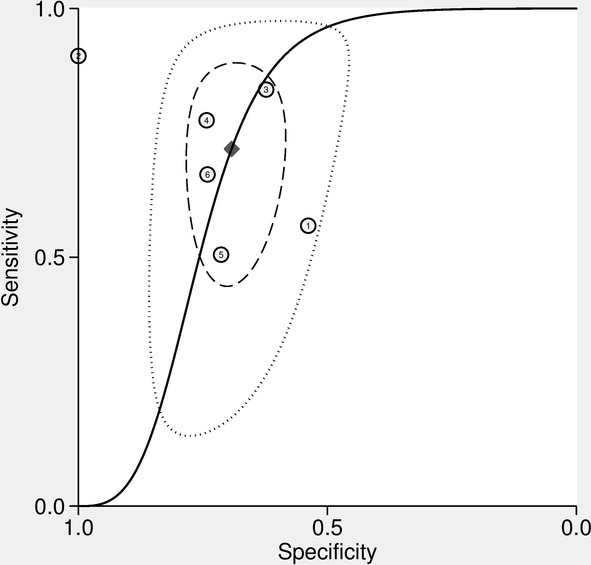
Figure 5.

Hierarchical summary receiver operating characteristic (HSROC) curves of 18F‐FDG PET/CT for prediction of PD‐L1 expression in NSCLC patients ( ) Observed data, (
 ) Summary Operating point SENS = 0.72 (0.58–0.82) SPEC = 0.69 (0.64–0.74), (
 ) SROC Curve AUC = 0.74 (0.70–0.78), (
 ) 95% Confidence Contour, and (
 ) 95% Prediction Contour.
