
Figure 2.
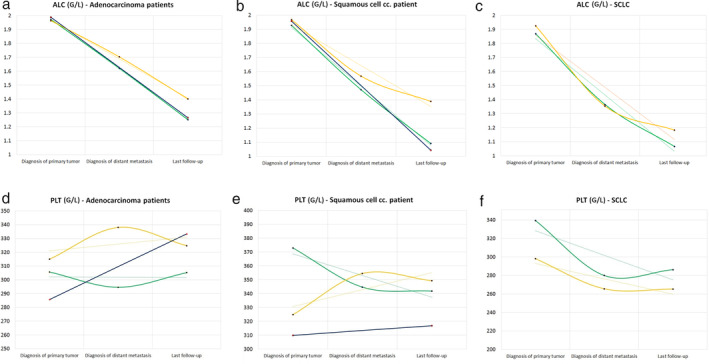
Longitudinal analysis of average absolute lymphocyte count (ALC) and platelet count (PLT) according to histopathological type of the primary tumor. Figures (a), (b), and (c) illustrate the longitudinal changes in average ALC in adenocarcinoma (ACC) patients, squamous cell carcinoma (SCC) patients and small cell lung cancer patients (SCLC), respectively ( ) Brain, (
 ) Bone, (
 ) Control. Figures (d), (e), and (f) illustrate the longitudinal changes in average PLT in ADC patients, SCC patients and SCLC, respectively (
 ) Brain, (
 ) Bone, (
 ) Control. The y‐axis corresponds to the value of the given complete blood count (CBC) parameter, while the x‐axis shows the time frame according to the date of diagnosis of the primary tumor, distant organ metastasis and last follow‐up. The control group consists of stage M0 patients and patients with other distant metastases. The dotted lines represent the linear trendline for each CBC parameter. P‐values for the distant organ metastases and assigned CBC parameters were obtained by the nonparametric Friedman test and Wilcoxon signed‐rank test.